
Guest Blog by Daniel Haasbroek, Principal Engineer Structural, thyssenkrupp. Daniel has worked at thyssenkrupp for the past 14 years as a structural engineer specialising in balanced machines.
thyssenkrupp have been manufacturing stackers, reclaimers and shiploaders since the early 1900s. Our design principles leverage these many years of experience combined with updated engineering approaches to account for newer design codes, newer equipment (mechanical and electrical) and of course analysis methods such as FEA.
In my group, structural engineers design the primary steel to support all the mechanical, electrical and materials handling equipment such as conveyors and chutes. Secondary steel such as walkways, stairs, ladders and platforms designed by others and are only considered for the loads they apply to the structure. We focus on ensuring weldabilty of the parts, transport studies, site-construction support all the way up to final commissioning.
Our design recipe can be summarised as:
- Extract critical loads from frame analysis software results where we have already analysed about 25 configurations with about 300 load cases each.
- Build the FEA model from CAD (Creo or Space Claim) and add boundary conditions and loads.
- Analyse and present evaluated results in context:
- Show mesh, typical boundary conditions and loads
- Show typical deformation screenshots to confirm that the boundary conditions and loads achieved the expected deformation shape
- Show the von Mises stress for a particular load case as well as the von Mises envelope for all load cases to give an idea of the “stress flow”
- Lastly show stress volumes above predefined cut-off points (the capped iso-surfaces feature from Ansys) to ensure the highest stresses in the model are visible
- Show buckling mode shapes and load multipliers.
Caption: Daniel Haasbroek recently presented this FEA project work at LEAP’s Ansys User Group (Structures) – watch the video above for the full presentation
AS4324.1 2017 allows design according to AS3990 (permissible strength method) or AS4100 (limit state method) but enforces additional conditions to make the design much more conservative.
Where the material yield strength is higher than 70% of the material ultimate tensile strength (uts), a modified yield strength must be used which is the average of yield and 70% of uts – which for GR350 steel reduces yield from 350 to (350+0.7×450)/2 = 332.5 MPa for thinner plates.
A permanent dynamic effects (pde) factor (g/30 horizontally and from g/10 up to g/8 vertically) must be added to (or subtracted from) all masses in the direction where it has the most adverse effect on design strength. It must also be taken into account for fatigue analyses.
Load combinations prescribed in Table 3.7 must meet a factor of safety (FOS) which varies from 1.5 for main combinations loads only, 1.33 for Main loads plus additional load combinations and 1.2 for combinations of Main + Additional + Special loads. Some specific special load cases may use a FOS of 1.1.
Suspensions are dedicated members (not frames) under permanent tension and must meet a FOS of 4 to 5 against uts. We are required to include redundancy for most suspensions, cylinders, etc. and we cannot rely on any mechanical or electrical safety mechanisms to protect our design. Thus, we have to prove that, if all safety mechanisms fail during the accident, the machine will not suffer a catastrophic collapse.
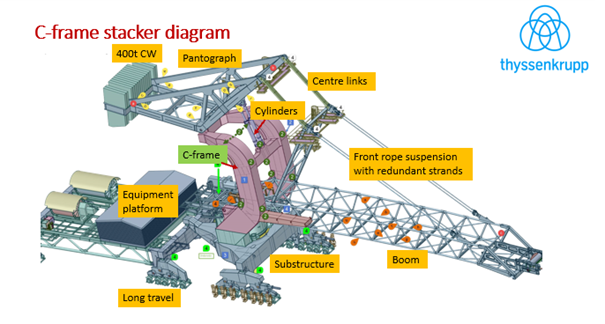
As an example, here is an annotated diagram of a C-frame stacker, which we recently commissioned. We used Ansys FEA during our verification of the C-frame design.
The machine is “back-heavy” with the cylinders in tension under no-load conditions. With maximum load on the belt, the machine becomes “front-heavy” and the cylinder goes into compression to ensure that the boom angle is maintained. When stacking, dust suppression is an issue so the boom is lowered as close to the stockpile as is regarded as safe. As the stockpile grows, the boom is luffed up to maintain this gap.
On the left diagram below, the annotated C-frame geometry is shown with colour-coded plate thicknesses. The opacity on some plates is reduced to allow us to view inside. On the right, the C-frame is shown with load application points for the pantograph (5053, 5054) at the top, cylinder bottom pins (2176,2177) in the middle and the main boom pivots (3022, 3202) lower down, as well as remote point spiders for the rear slew drives.
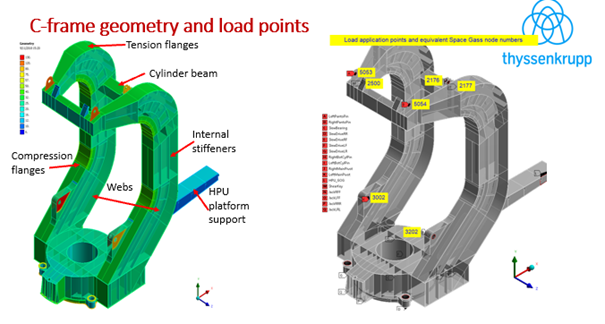
The analysis model is restrained by a remote displacement at the slew bearing and the slew moment is restrained by the slew drive remote points (where the pinions contact the slew gear).
We require that the models and analyses be properly named as shown with the red rectangles. This ensures that any screenshots are self-explanatory. The analysis is prepared for multiple load cases by selecting the correct number of load steps under analysis settings.
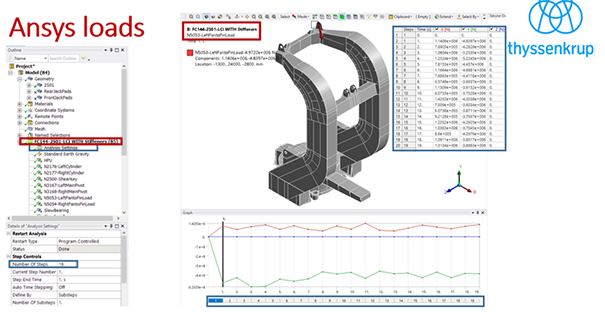
Using the graph and tabular displays, loads can be copied directly from the source (usually Excel) and pasted into the table. The graph gives an overview of the X, Y and Z components for each load step.
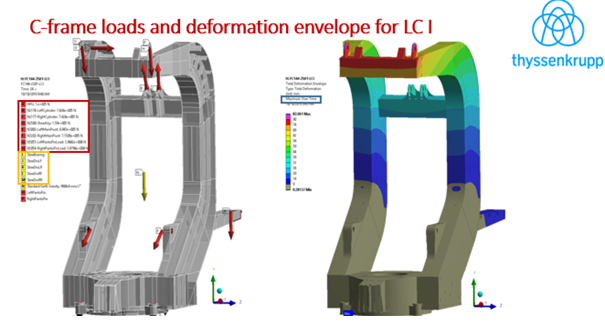
The image on the left above shows the loads and boundary conditions at a specific load step. The loads are identified inside the red rectangle in the legend and the restraints identified in the orange rectangle. Flag N shows the gravity vector at the COG of the structure. It is important to inspect the force directions to see if it makes sense. The pantograph pin loads are downward and in the global positive X-direction, whereas the cylinder forces show the cylinders in tension with balancing components (upwards and in the global negative X-direction)
The right hand image is an envelope of the total deformation through all load steps (notice the flag “Maximum over time” inside the blue rectangle in the legend. The maxima for all load steps also produce the expected deformation pattern with the cantilever end loaded by the pantograph and CW having the highest deflection.
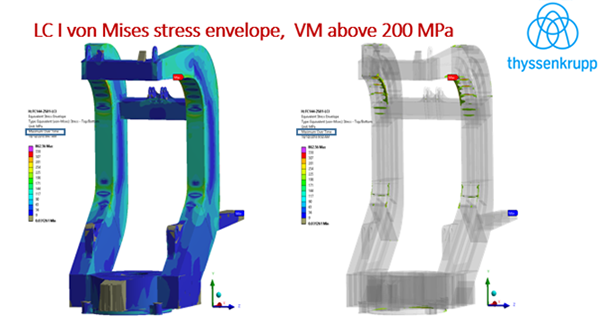
The image on the left above shows the von Mises stress envelope for all load steps (opaque view of outside only). In the image on the right, only stresses above 200 MPa are shown (Ansys capped iso-surfaces) on a semi-transparent structure. This prevents high stressed regions from being obscured by lower stressed elements.
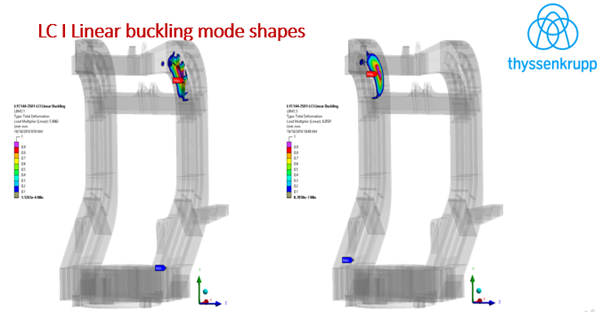
Show above are the first and third linear buckling mode shapes with load multipliers of 5.9 and 6.1 respectively. With a pre-stressed eigenvalue analysis, it is always difficult to select which load step to use for pre-stressing. In previous versions of Ansys it was easier to run the strength analysis first and then to inspect each load step for either the biggest deformation or the highest stress, to decide which load step will show the least buckling resistance. This load case was then duplicated and appended to the other load steps. The Eigenvalue analysis would by default operate on the last load step, saving the trouble of storing all intermediate results.
Currently we save all data for each load step and the run one or more the eigenvalue analyses from the identified load step number. This saves us from running the strength analysis twice but increases file sizes significantly.
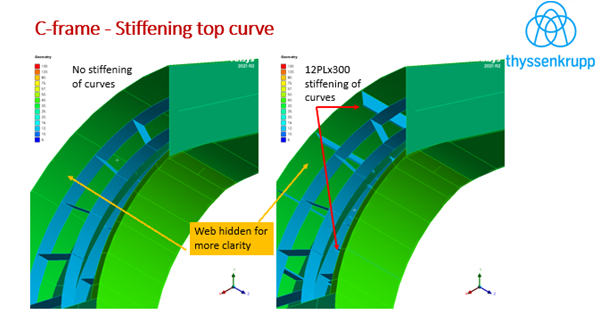
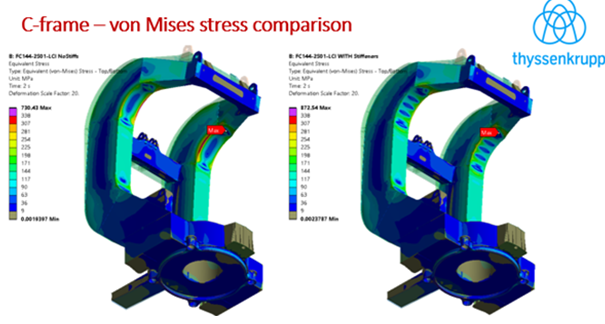
At the start of analysing the C-frame it was found that both curved flanges outer in tension and inner in compression deflect towards the centre line of the curved box. 12PL stiffeners 300 mm high were then added to both curves as shown here.
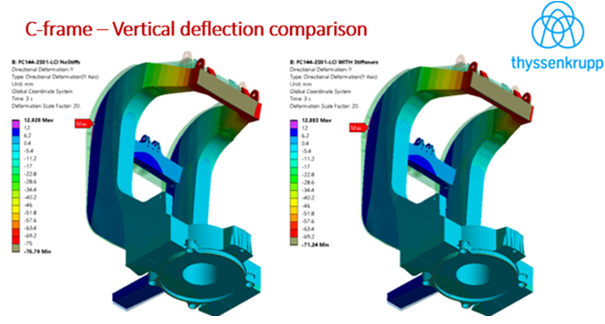
Comparisons between the two models (shown below) proves that the stiffeners reduce the maximum vertical deflection at the cantilever tip by ~5 mm.
Likewise, comparing the von Mises stress pattern between the two models (below) shows that the stiffeners have straightened the inner curved flange to force more of the flange to contribute to the moment resisting compression cross section. A similar occurrence is found on the upper (tensile stressed) part of the curved flange.
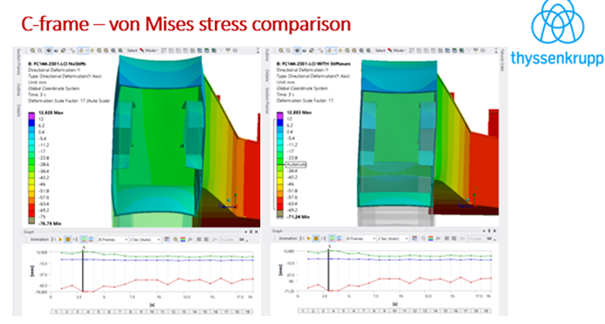
Comparing the deformed shape of the two models at a section with the same enlargement (17x) shows the contribution of the stiffeners (right hand image) to maintaining the section shape compared to the non-stiffened cross section (left hand image).
“This project has been an excellent example of the useful technical insights we glean from Ansys mechanical simulation, which forms a valuable part of our design and verification process at thyssenkrupp industrial solutions.” Daniel Haasbroek, thyssenkrupp industrial solutions.