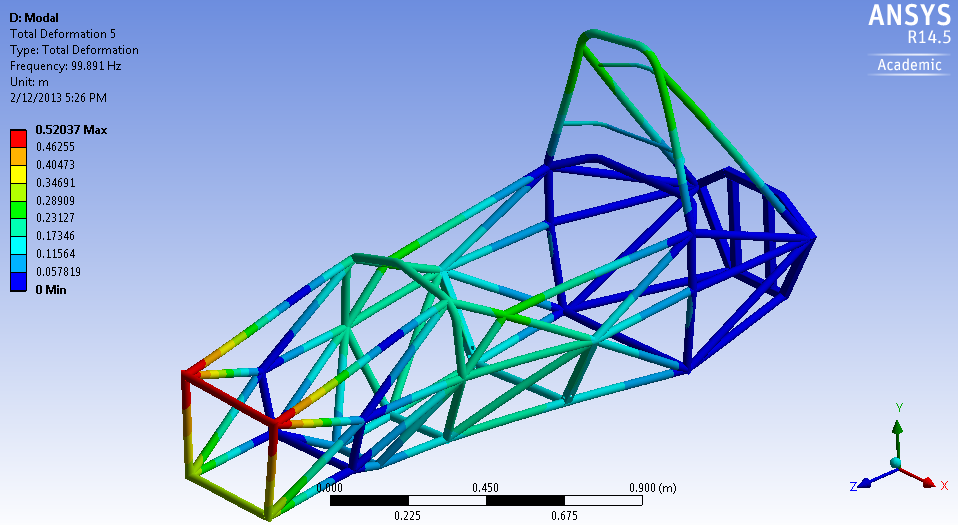
In February 2014, Curtin Motorsport Team’s Frame & Body Technical Lead Nisarg Thakrar and Chassis Thesis Project Lead John Christensen conducted torsional stiffness validation testing on the team’s 2012 chassis. The purpose of this physical testing was to determine the chassis’ actual torsion stiffness value and to validate the results predicted through FEA simulations performed in ANSYS R14.5. Indirectly, this analysis could potentially be used to help the team’s further investigations into whether torsional stiffness has any noticeable effect on the handling characteristics of a Formula SAE race car under accelerating, braking and cornering loads.

It is known that the torsional stiffness of a race car chassis affects the ability to tune the suspension. Cornell (2002) plotted overall vehicle stiffness against frame (chassis) stiffness in the figure below, with suspension stiffness plotted relative to this. It should be noted that this graph has been normalised by expressing the spring, suspension and chassis stiffness as a ratio of the spring rate.
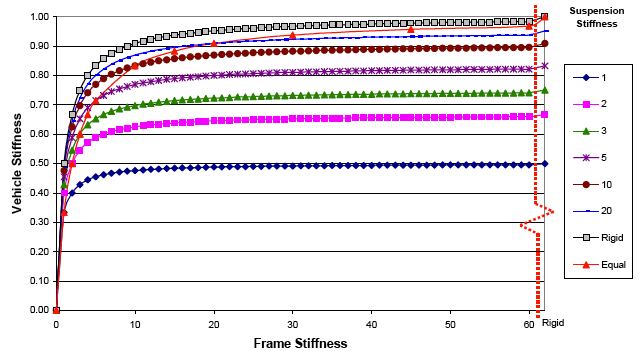
Figure 1: Normalised chassis stiffness for frame and suspension stiffness, wheel rate = 1 (Cornell 2002).
This figure shows that the chassis stiffness ultimately determines the extent to which suspension can be stiffened; there comes a point where there is no net gain. It is known that in some historic racing series, the spring-dampers are simply replaced with ‘solid shocks’ (referred to as ‘solids’ throughout the article); the driver relies on the compliance in the chassis for the effect of a spring.
The primary method of testing was using a chassis torsion rig as shown in the figure below. With this apparatus, it was essential that only small measurements were to be determined. It was estimated that an equivalent torque of 2000Nm would result in a displacement of 2mm at the lower front wishbone mounts. This was to test the total chassis and suspension stiffness.
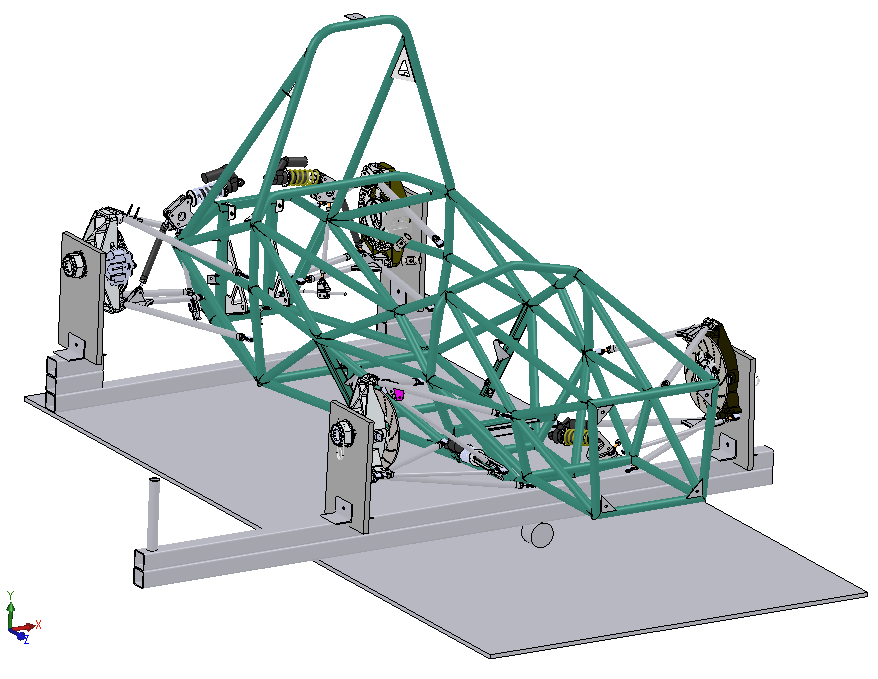
Figure 2: Torsion testing assembly model with CMT12 chassis and unsprung (CMT 2012).
The secondary method was to secure the rear bulkhead and produce a torque on the front wishbone mounts. The front wishbone points were secured using G clamps to the front lever arm of the test rig, and the rear bulkhead was secured to the welding table by G clamps and shimmed up to ensure that the chassis was in a neutral orientation (parallel to the floor plane).
It was noted that there would be some lateral displacement due to the pivot point’s geometry being circular as mass would be applied on that front lever arm. However it was calculated that this displacement would be negligible.
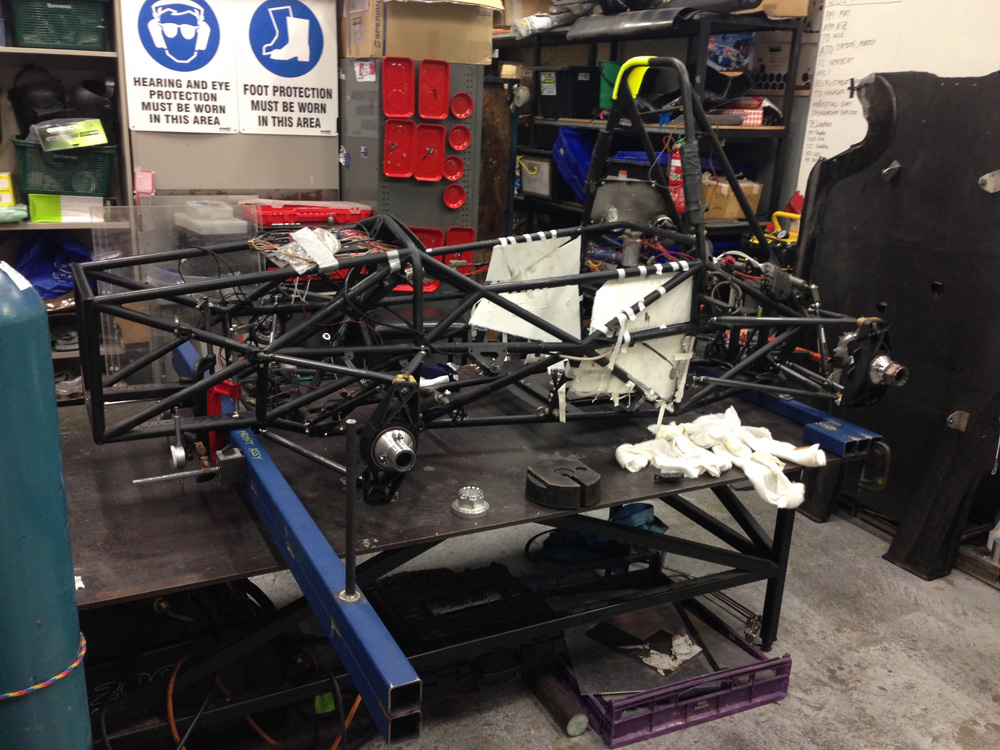
Figure 3: Torsion testing assembly in the CMT workshop.
Mass was added to the lever arm at a predetermined length on the front assembly of the torsion twisting rig, and two dial gauges measured the effective displacement.

Figure 4: G clamps and dial gauges on the front assembly.
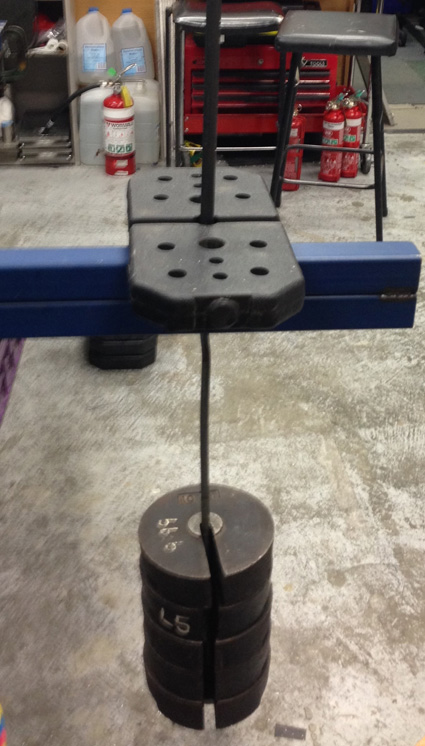
Figure 5: Mass applied on the front assembly.
Following the testing method outlined by Cornell (2002), the preliminary FEA determined that the 2012 CMT chassis torsional stiffness was 744 Nm/degree. Actual torsional stiffness measurements are shown in the following table with these configurations; bare chassis, bare chassis with engine block, chassis with solid shocks, chassis with engine and solid shocks, chassis with spring dampers, chassis with engine and spring dampers.
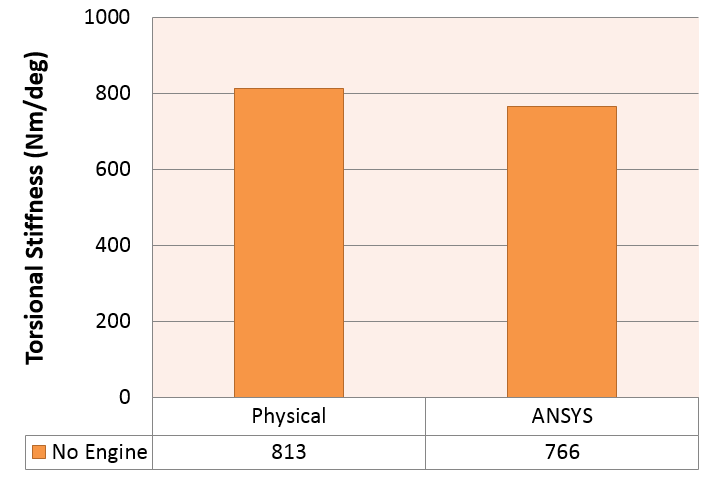
Figure 6: Comparison of ANSYS Simulation to physical testing.
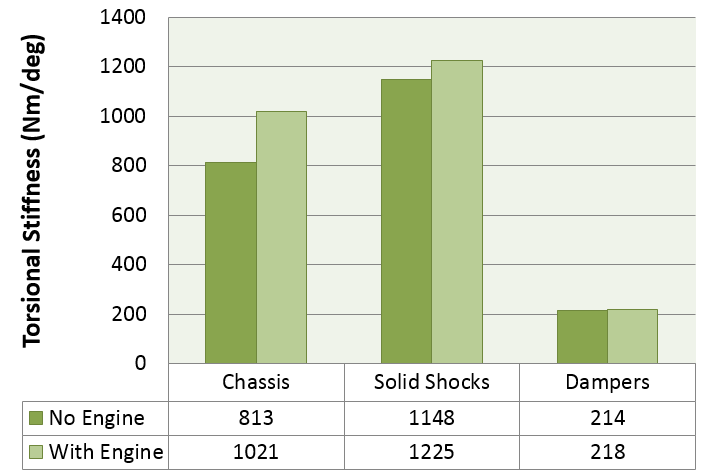
Figure 7: Physical testing results.
As shown in the charts above, there are small discrepancies between the ANSYS simulations and the results from physical testing. The difference for the bare chassis test amounted to 6.1%. The torsional stiffness increase between the bare chassis and the chassis/engine configuration was 25.6%. It was known that the engine block was a stressed member, however it was now known to what extent it was being stressed. Stress calculations can now be performed on the engine block to ensure that there are zero reliability problems for the car, and the chassis team can continue to integrate the engine into the chassis structure, gradually reducing the chassis members in the engine bay and reducing weight.
The next configurations utilised wishbones and solid shocks. Physical testing showed large increases for both configurations; the first of these was the chassis and solid shocks, and the second configuration also utilised the engine. Measurements showed increased torsional stiffness over the bare chassis measurements by 41.2% and 19.9% respectively. These results were not expected as the introduction of wishbones and the unsprung assembly (uprights, spindles, bearings, brake carriers) also had the potential to introduce a large amount of compliance into the system. It was noted that, through the introduction of these extra components, the number of constraints had increased. The ANSYS FEA was remodelled and rerun with the additional constraints around the rear suspension mounts, and the equivalent forces on all the front suspension mounts, and the difference between physical validation and software simulation was found to be just 5.4% and 12.5% for the respective configurations as shown in the previous table.
The final physical tests performed measured the torsional stiffness values of the chassis set up with Öhlins TTX25 MkII dampers using Manitou 350×2.0 coil springs on all four corners, with an additional weight of 80kg in the driver’s seat to simulate static loading. As shown in the table, the stiffness decreased for both configurations; the damper/no engine measurement was 18.6% of the solids/no engine configuration measurement, and the damper/engine measurement was 17.8% of the reading measured for the solids/engine configuration. Using the results from this final test, the CMT12 vehicle stiffness to chassis stiffness ratio is calculated to be of the order of 1:5.
This testing was performed as part work towards the author’s final year project, which is looking into carbon fibre monocoque chassis manufacturability and feasibility. In the near future, John Christensen is intending to publish a technical article on the carbon fibre and aluminium testing performed and the resulting implications for the feasibility of manufacturing a carbon fibre monocoque chassis in the future.
Thanks to John Christensen, Chassis Thesis Project Lead at Curtin Motorsport Team.
[box]
John Christensen is a member of Curtin Motorsport Team in the Frame & Body Technical Area and also assists with team development, showing fellow team members pointers with FEM setup and analysis. He has just finished his Bachelor of Mechanical Engineering undergraduate degree at Curtin University in Bentley, Western Australia, completing his final year honours thesis on carbon fibre monocoque chassis feasibility and benchmarking the current steel space frame chassis using both ANSYS FEA simulation and real-world physical testing as validation.
John is looking forward to performing composite structure simulations and comparing these against physical testing undertaken during his thesis research as he pursues a graduate position in industry.
[/box]