
On 31 January 2003, a four car Tangara passenger train G7 on run from Sydney Central railway station to Port Kembla derailed about 2 kilometres south of Waterfall railway station. The train driver and six passengers were killed and many passengers suffered serious injuries.
Following the accident considerable media coverage was given to speculation concerning its cause. Numerous causes were canvassed and discussed in numerous media reports. The possible causes mentioned ranged far and wide. They included: problems with the track, excessive speed, poor maintenance, inadequate safety management, alleged prior mechanical problems which allegedly caused a surge in traction power, modification to a faster AC traction motor, motor power failure, brake failure, human error, the health of the train driver, mechanical failure, power surge when the brakes were applied, vandalism or sabotage, including rocks and ballast allegedly having been placed on the track.
The facts of the investigation
- The investigation found no evidence to pin point the cause of the accident
- The data logger fitted to G7 was not operative at the time of the accident, therefore data and hence evidences were not available.
- The train driver, having died in the accident, was not available to provide information on events.
- The train guard claimed not have any relevant recollection and he was unable to give evidence;
- The possibility of a significant mechanical malfunction was not readily identifiable;
The investigation had to rely almost entirely upon technical analysis to provide a factual basis for the drawing of inferences as to what occurred. The Finite Element Analysis conducted formed an important part of the technical analysis.
LEAP was commissioned by Department of transport of NSW to conduct an dynamic analysis to simulation the Waterfall train accident. The objectives of the analysis were:
- To understand and to identify the derailment mechanism and, to determine the velocity at which Tangara train would theoretically overturn, at the curved track of approximately 240 m radius.
- To reconstruct the sequence of events of the accident;
- To determine the causes of the main damage to the train structure due to the impacts between the train and infrastructures such as overhead wiring structures, rail track and rock cutting.

ANSYS/LS-DYNA for Crash Simulation
The simulation of vehicle crash response involved many complex features. These collision response mechanisms include:
- Nonlinear material behavior,
- Large deflections and rotations,
- Contacts at interfaces between structural components,
- Fracture and failure of structural elements, welds, and fasteners.
Stage 1: Derailment Simulation
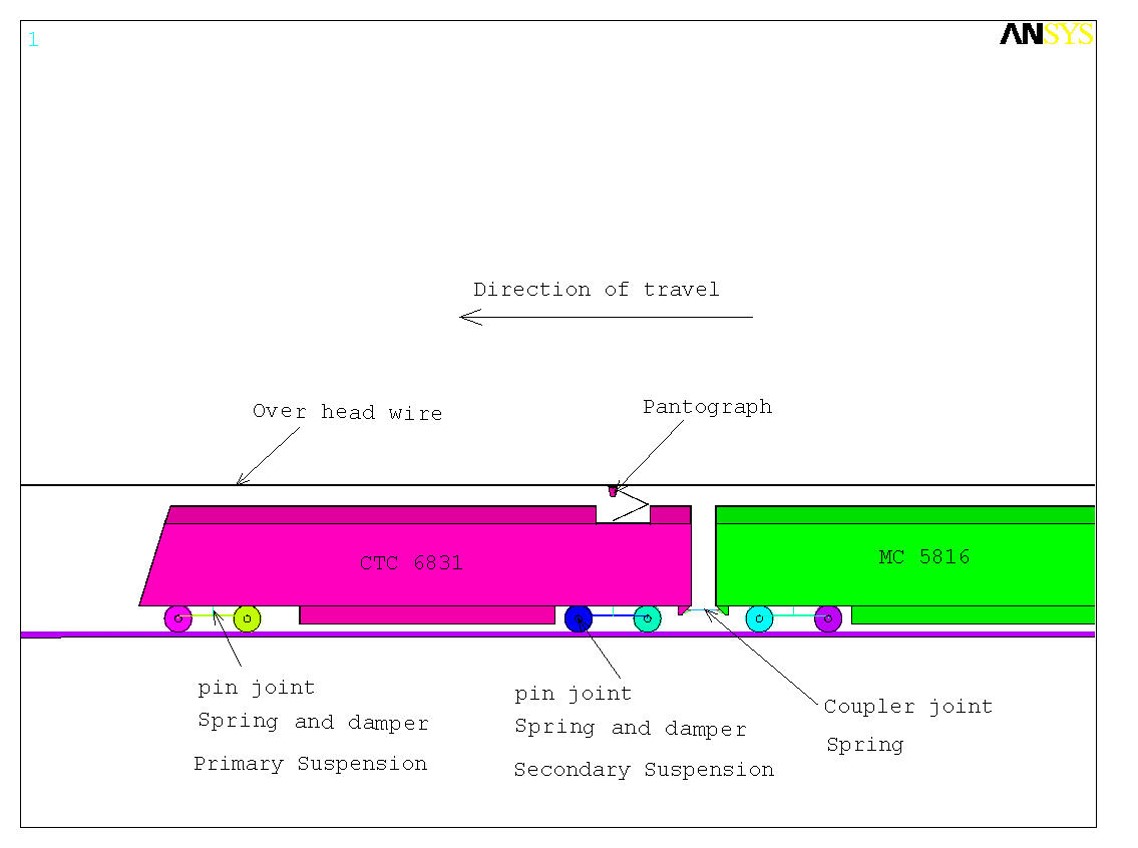
- Dynamic analysis with rigid car body linked with springs and joints.
- Predicts the speed that could cause rollover derailment at the location that was identified by the scuff marks and runoff marks;
- To establish the initial condition for deformable body crash simulation by predict the speed that the train is about to hit the stanchion and rock wall.
Analysis Results
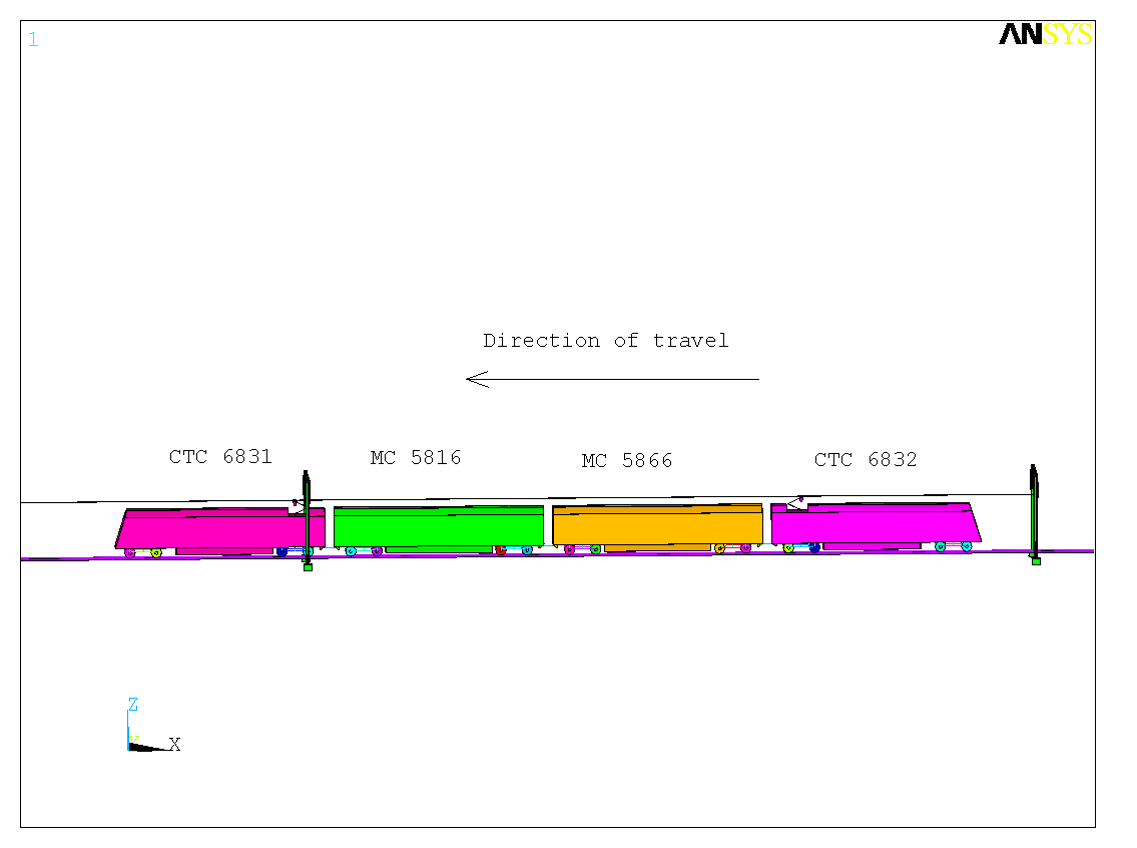
A range of velocity (from 100 to 120 km/hr) were simulated using the four-carriage train model.
The rigid body dynamic analysis shows that the speed to cause derailment at the observed location is approximately 117 km/hr.
The velocity at the time the train is about to impact with stanchion SW40+805 was calculated to be 98 km/hr. This represents a loss of 19 km/hr having occurred due to the forces experienced in the rollover and other preceding events. This velocity was then used as initial velocity for the crash simulation.
Stage 2: Crash Simulation
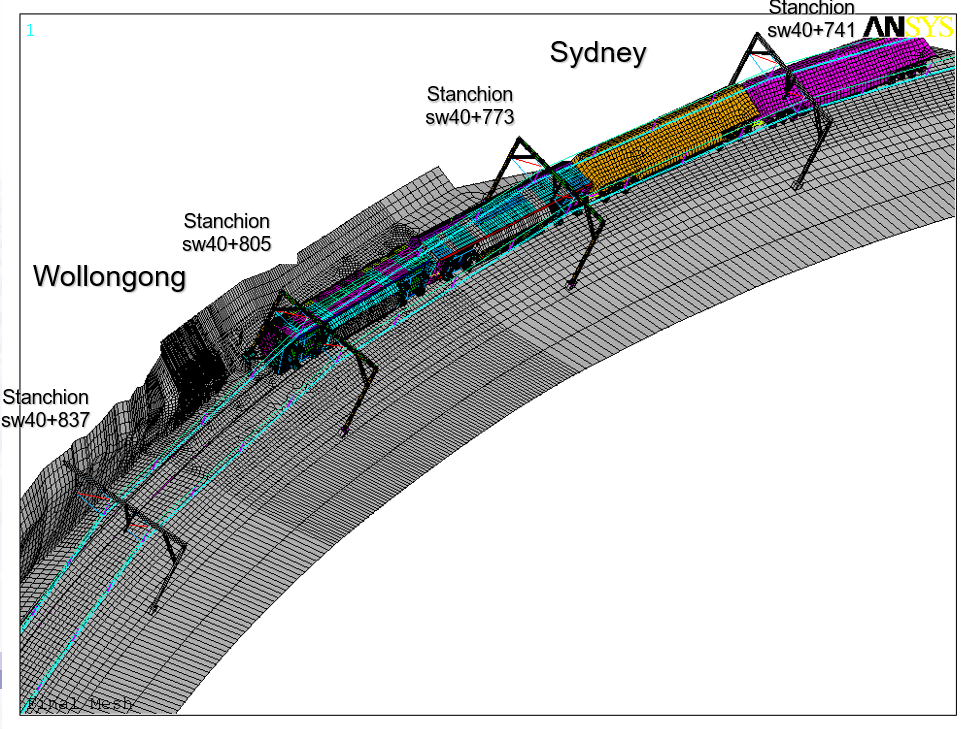
- Deformable body nonlinear dynamic analysis to simulate the train impacts with stanchions and rock cutting wall.
- The train geometry was created based on SRA drawings.
- Rock wall geometry is accurately modelled using RIC laser scan data
- Material properties input includes: density and mass, elastic modulus, yield stress and stress-strain curve, failures strain, friction etc.
- The FE model contains 20,000 elements. A solution of the crash simulation model takes about 24 hours running on a computer networks with 4 dual CPUs Dell high-end workstations.
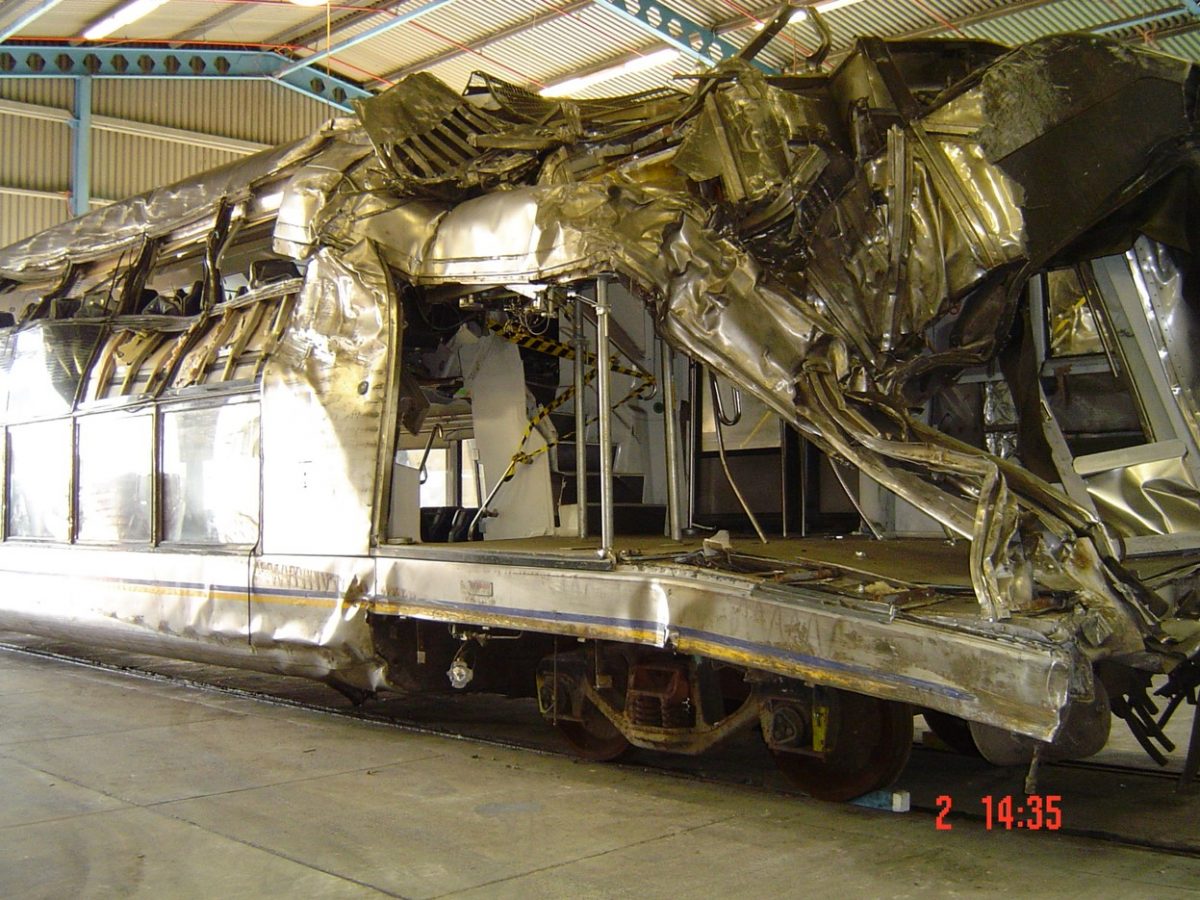
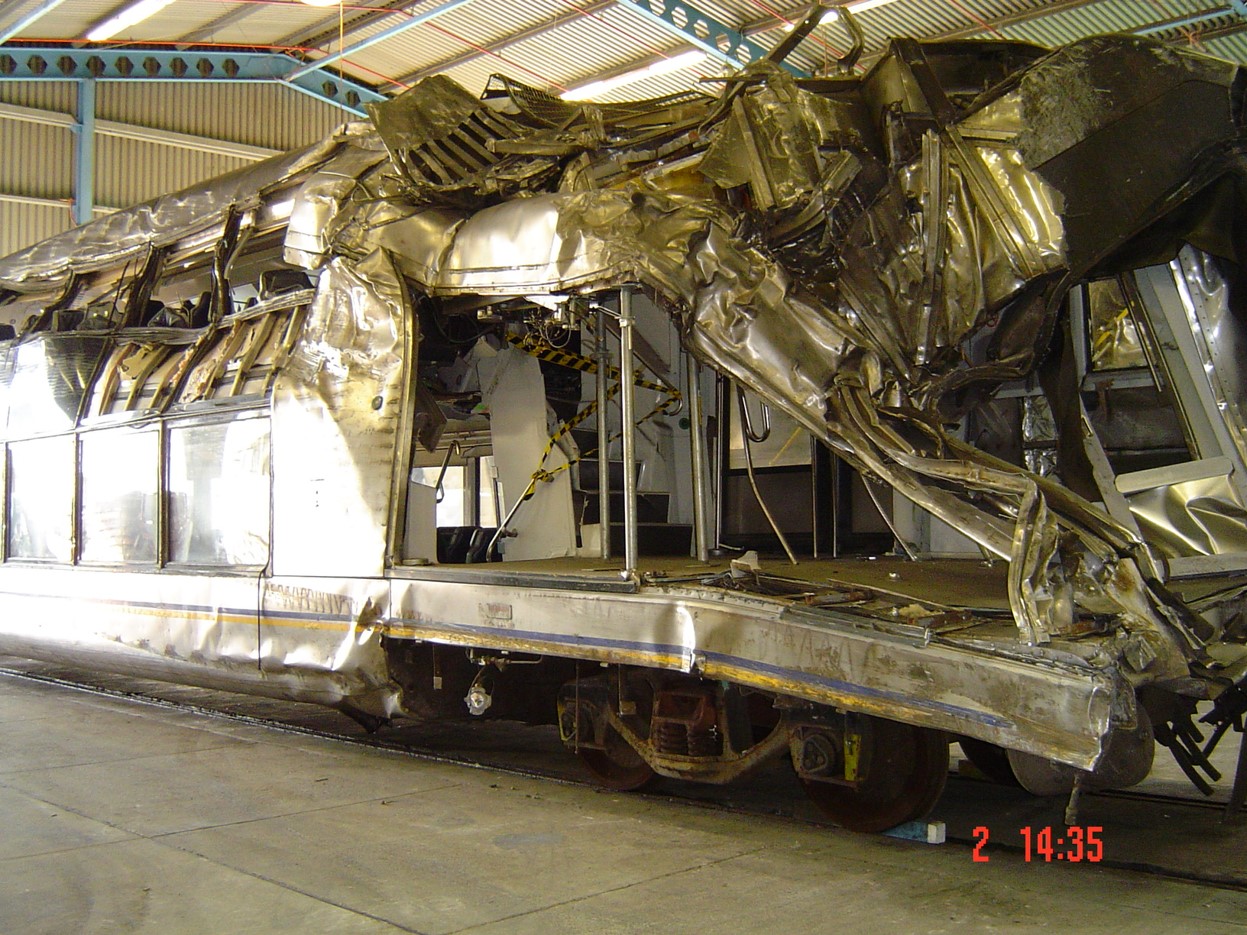
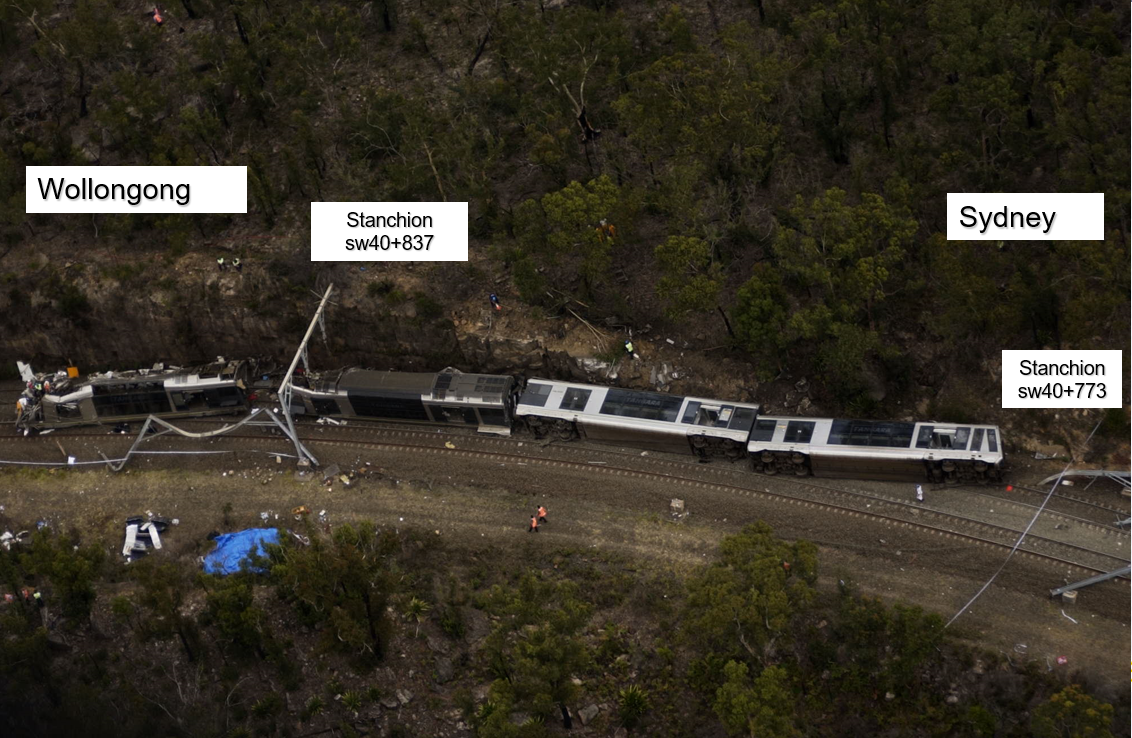
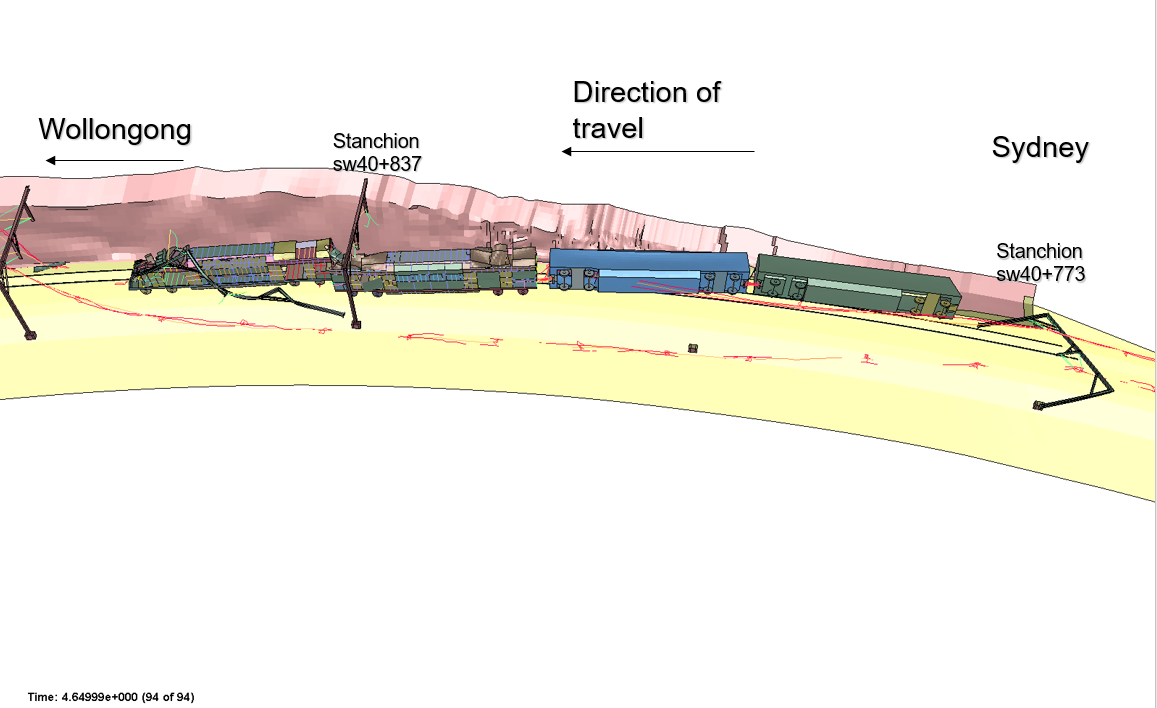
The analysis result verification includes a comparison of the predicted results from the simulation with photographs showing the final resting location of the train, structural damage to the carriages and the geological investigation report.
Identified Critical Events
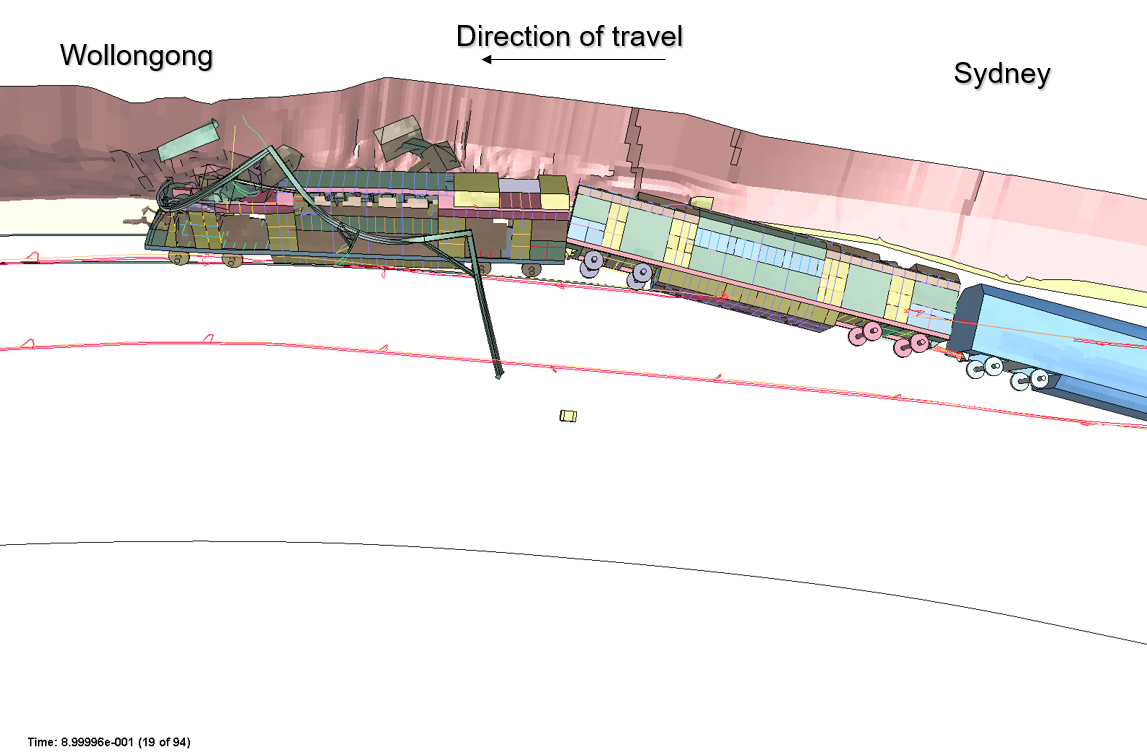
The following are critical events were identified from the simulation result. These observations are made in the context of viewing the animation results. The reference time 0 second is the starting time of the crash simulation.
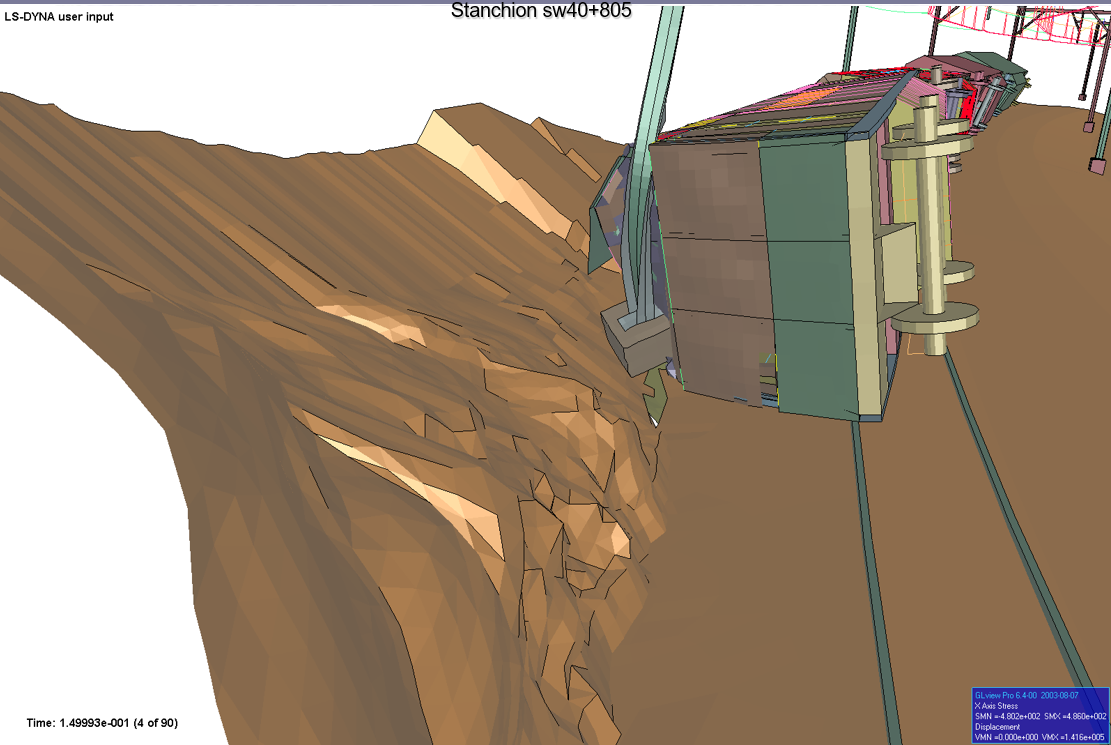
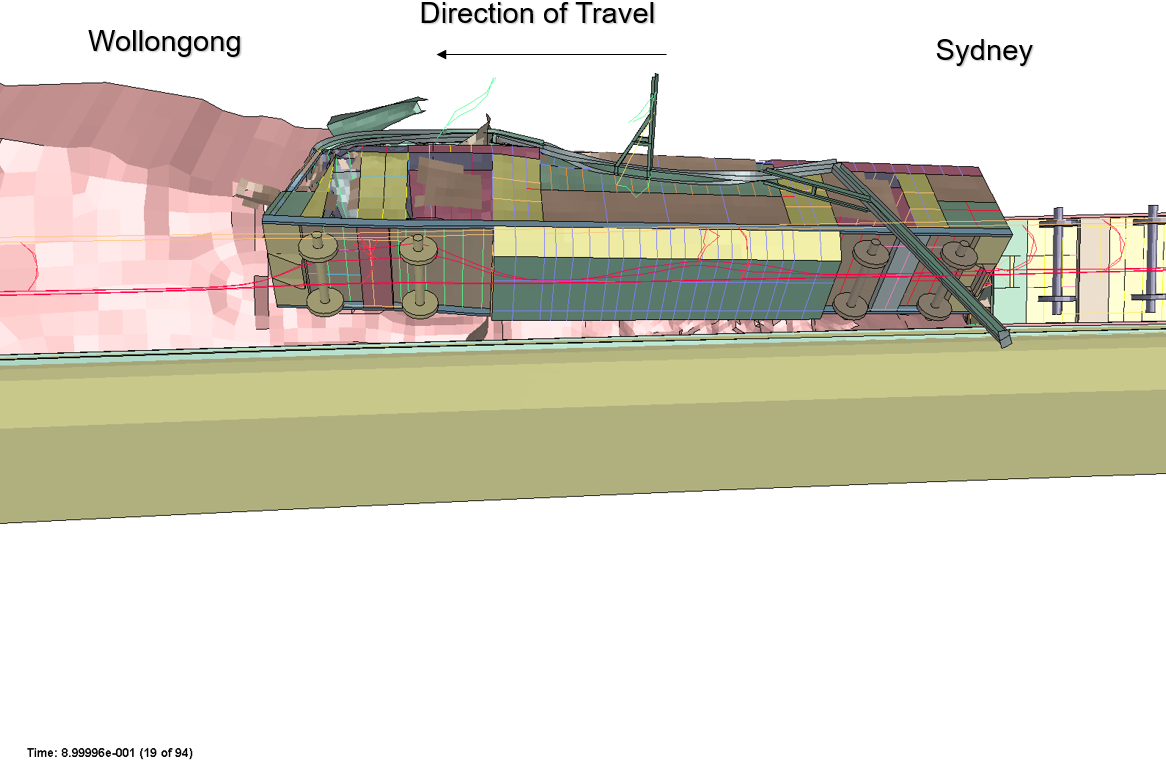
The leading carriage collided with stanchion sw40+ 805
After derailment, the train rolled over and slid on its side over the up rail track with its roof edge slid on the rail bed. The leading carriage collided with the concrete footing first then stanchion sw40+805 itself at time about 0.1s. It pulled the 25 mm diameter star anchor bar out of ground and carried the stanchion with its concrete footing forward.
The footing block broke off
The concrete block jammed in between the rock cutting and the inverter on the front roof of the leading car. It pushed the inverter and the right front roof down significantly. It then broke off the stanchion at Time 0.25s.
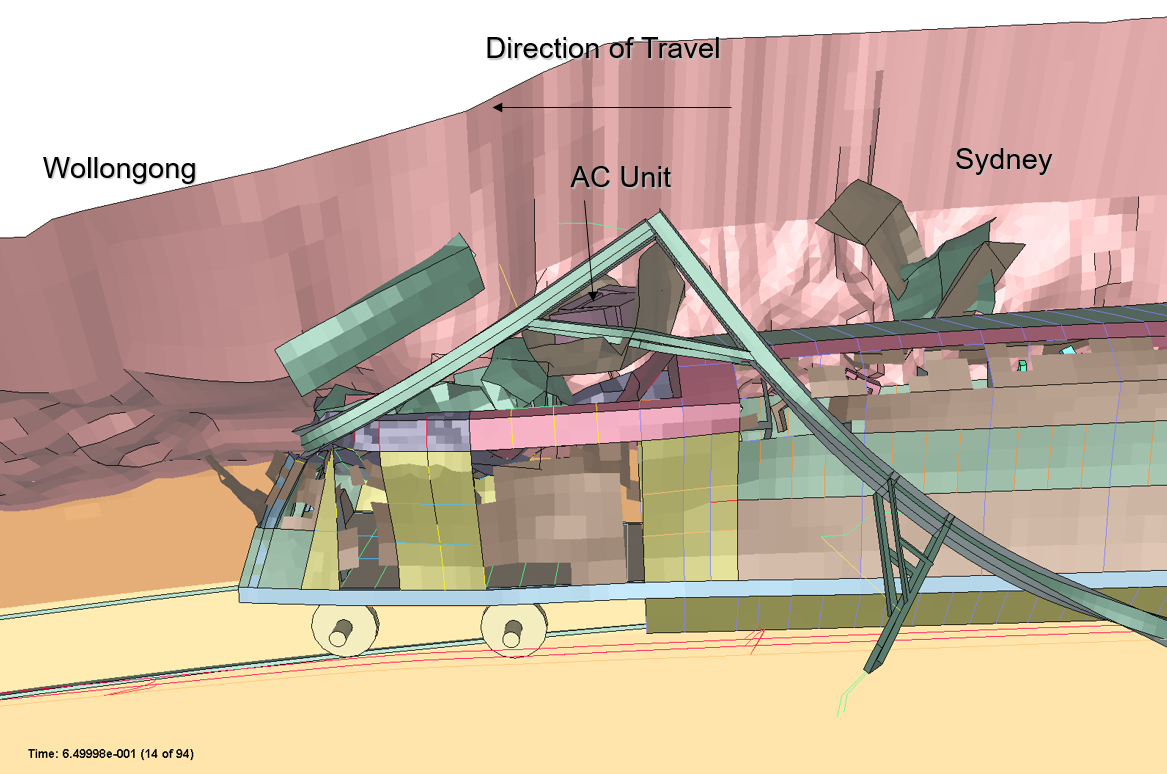
The AC unit displaced
The Air-Conditioning (AC) unit was thrown out of its mounting bay during the impact with the rock wall at time 0.65s.
The coupler broke
1.At 0.75 seconds, the leading car started to turn itself from a side position to upright position due to the impact with rock cutting wall. At this time the second car was still on its side. Therefore the front of the second car was at the right hand side of the leading car. The coupler between the leading car and the second was misaligned. The velocity of the leading car reduced due to the impact with the rock wall. The second car pushed behind it. The compressive force between the two cars caused further misalignment of the coupler. When the coupler reached its misalignment limit (about 45 degrees), the rotation was constrained at the coupler swing joint, and the misaligned compressive force or impact load produced a large bending moment. The muff coupling then broke under this loading condition.
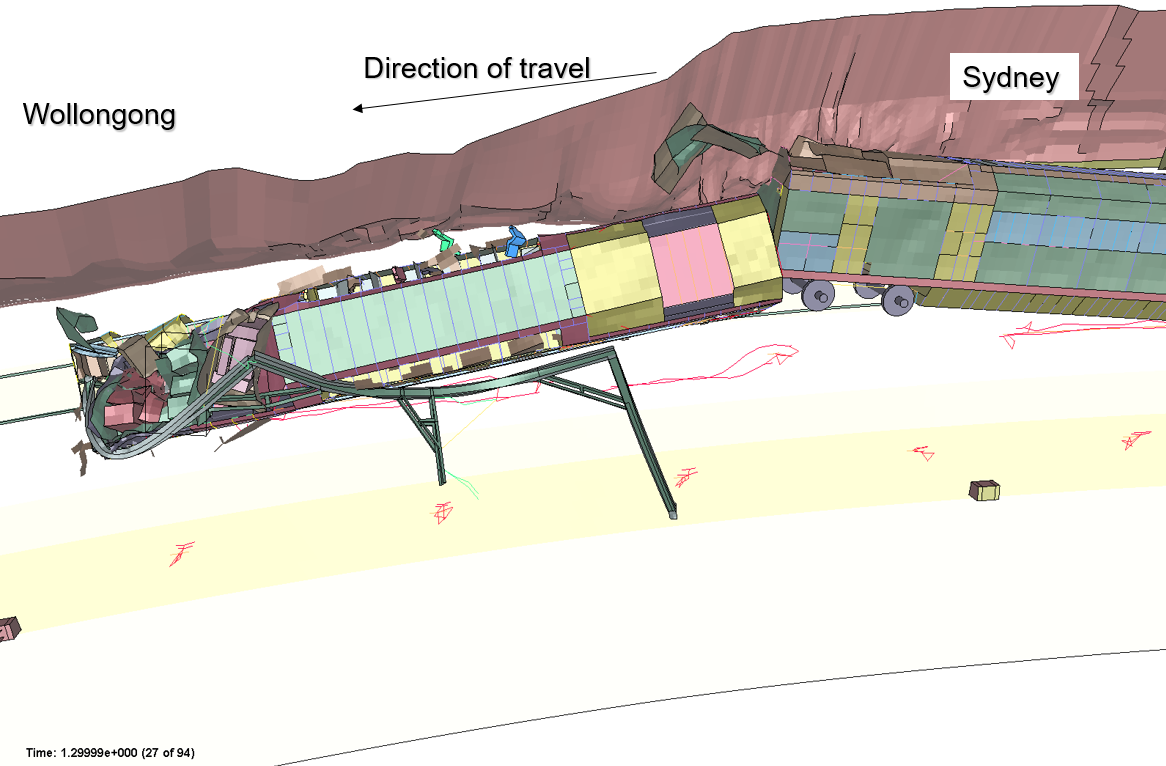
Car 1 slid along the “ramp” and impacted with rock cutting
The leading car slid on the ramp and impacted with the rock cutting wall. The reaction force pushed it up. The leading car turned itself upright and also went up along the ramp a few metres before dropping off (Time 0.85s). The main damage to the front top of leading car was caused by impact with the rock cutting wall, although the stanchion and its footing also caused significant damage.
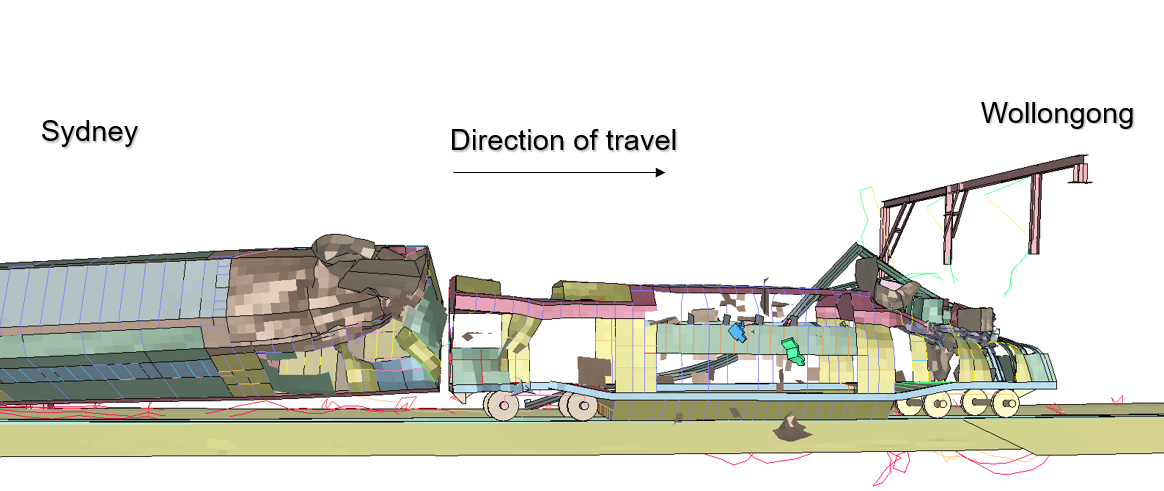
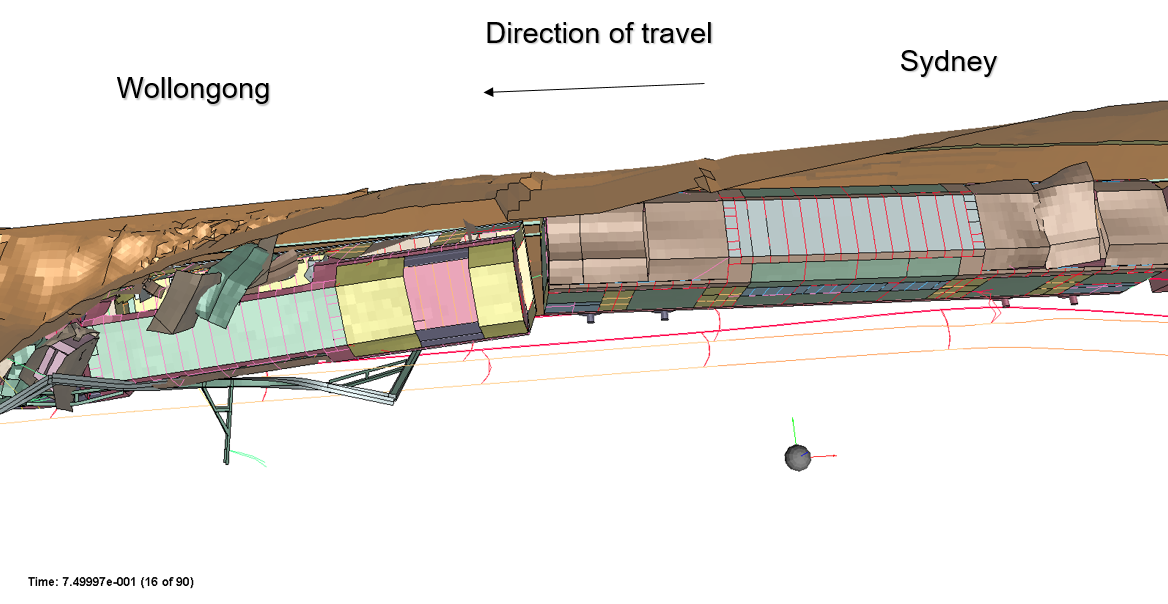
Impact between Car 1 and Car 2
After the coupler was broken, the second car impacted into the back of the leading car at time 0.9s. And the two cars then separated.
Passengers were thrown out
The passengers in the upper deck of the leading car were thrown out of the carriage during the upright turning of the leading car at about 1.1 second. The passenger’s simulated landing locations are within a 5 metre’s range to the actual resting locations.
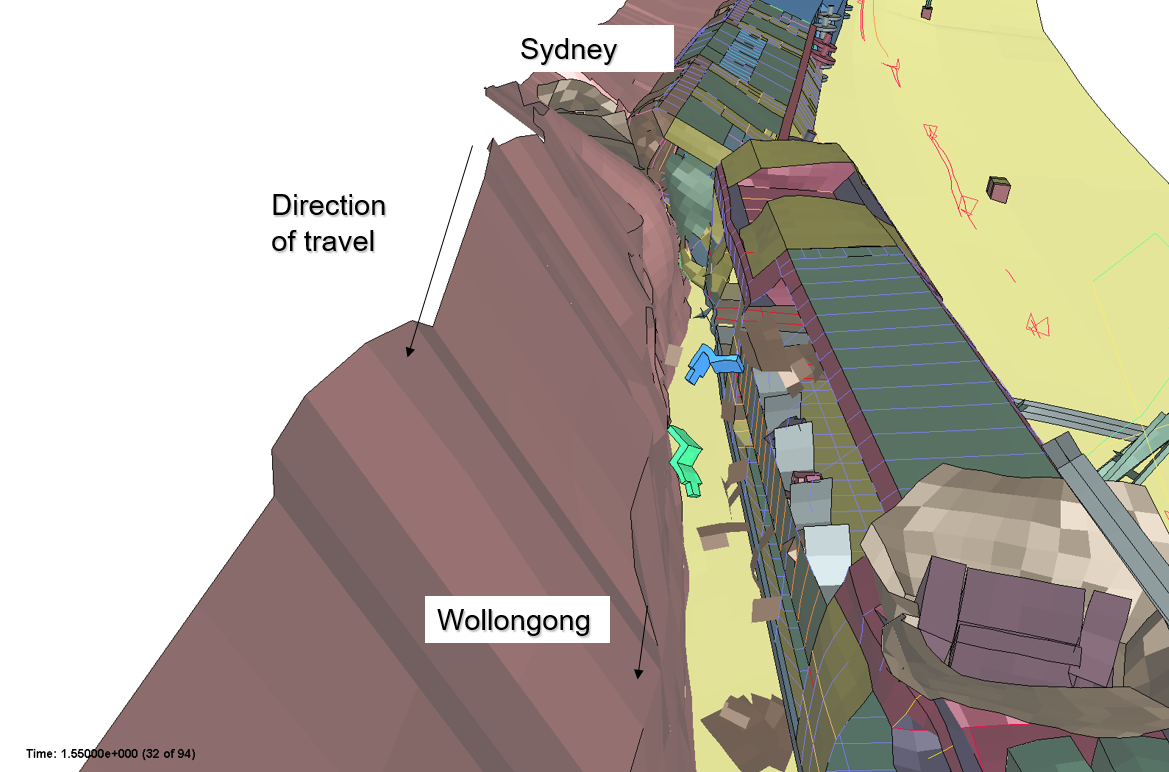
Car 2 impact with rock cutting
The second car slid along the “ramp” and impacted hard with the protruding rock wall. The main damage to car 2 occurred during this impact at time about 1.55 s.
Car 1 dropped off rock cutting
The leading car dropped off the rock wall and impacted with the ground at approximately 1.7 seconds. This impact severely damaged the main structural beam of the leading car.
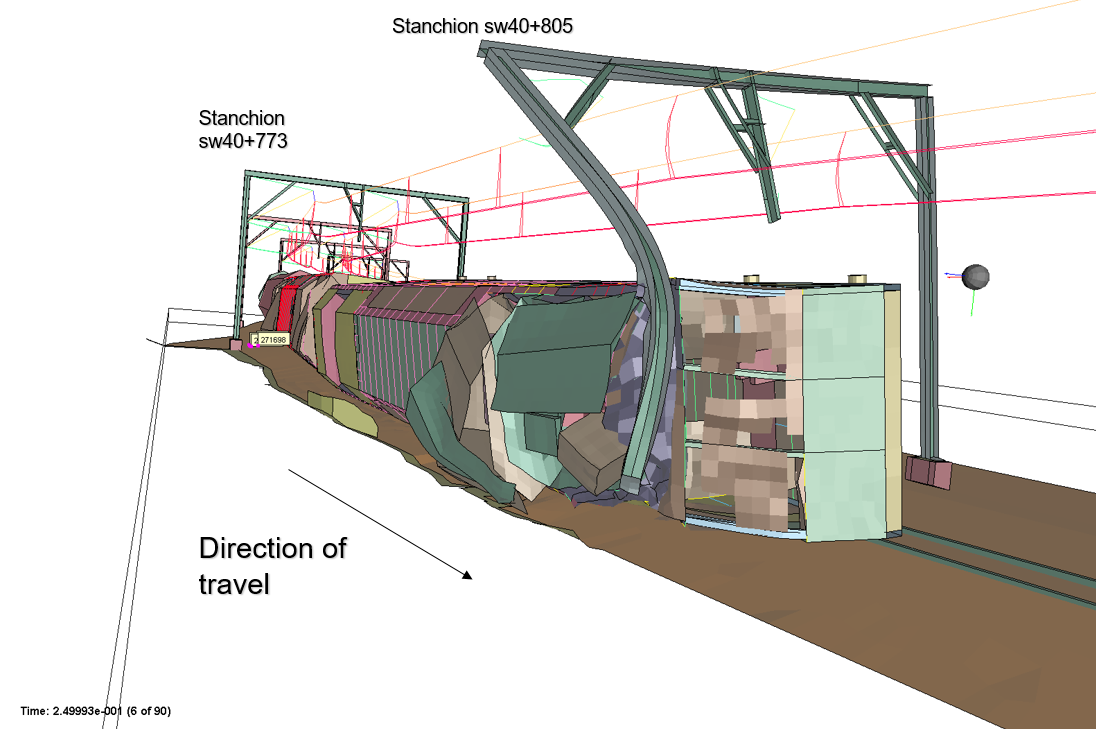
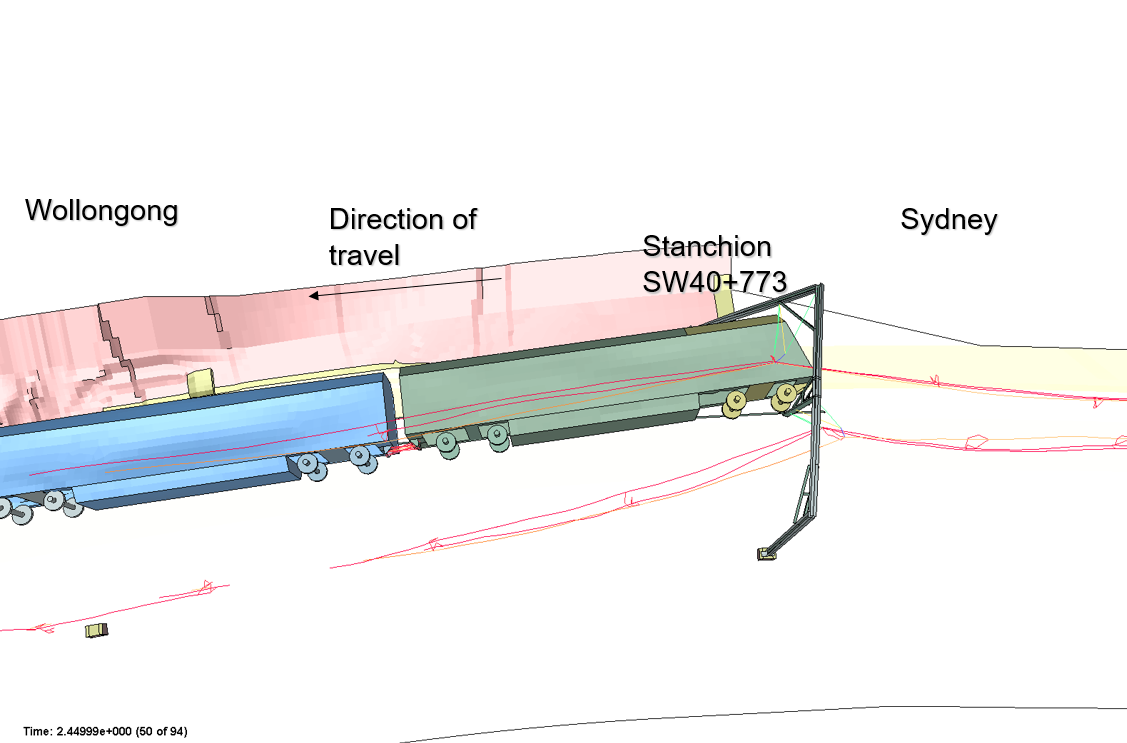
Car 4 impacted Stanchion SW40+773
The Air Conditioning (AC) unit which forms part of the rear roof of the fourth car (6832) impacted with stanchion SW40+773 at time 2.4s and brought it down.
Conclusion
The simulation result is consistent with the physical evidences including the carriages resting position and damages, the stanchions deformed shape and resting position. It reproduced the crash sequence of events and demonstrated the ejection mechanism for the driver and passengers. The predicted driver and the passengers landing locations are reasonably accurate.
The FEA simulation work was highly recognized by the Special Commission and the simulation result was extensively used in Commissioner’s final report to explain what might have happened during the tragic accident.
This is just one example of how FE analysis can be used to investigate high impact events. Contact LEAP today if you have specific requirements that you’d like to discuss, or visit us at Ausrail 2017 in Brisbane from Nov 21-23 – click here to arrange a meeting with our engineers on stand 718.