
Fatigue is failure under repeated or otherwise varying load which never reaches a level sufficient to cause failure in a single application. Component seems to lose strength after multiple load applications, appears to get tired, hence the name “fatigue”.
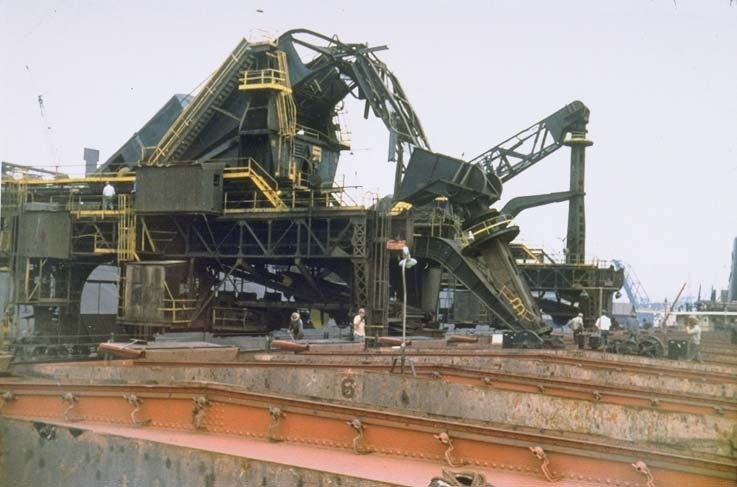
Figure 1: An example of a structure that failed due to fatigue
Failure caused by fatigue can be minor or catastrophic. The consequences of failure are often very costly and it is estimated that 80-90% of all structural failures are caused by fatigue. Catastrophic failure by fatigue often occurs without warning at low stress levels (see Figure 1, 2 and 3).
A paper clip that is straightened and then bent back and forth in the same spot about five times will fail and break into two pieces. That is an example of a low cycle loading where plastic deformation and large strains result from the first few loading cycles (see second image in Figure 2). A bicycle crank in use for years may fail as a result of high cycle loading where the response of the crank to the repeated loading is elastic. In a similar fashion the casing of a turbocharger housing might eventually fail from repeated thermal and mechanical loading even though inspection in its early life shows no signs of damage (third image in Figure 2).
Fatigue cracks start from microscopic imperfections (dislocations) in the material’s (usually metal) crystalline structure. Very small stresses can result in crack initiations. The forward and backward motions of dislocations along the slip plane at a microscopic level can initiate a crack usually near the surface of the material.
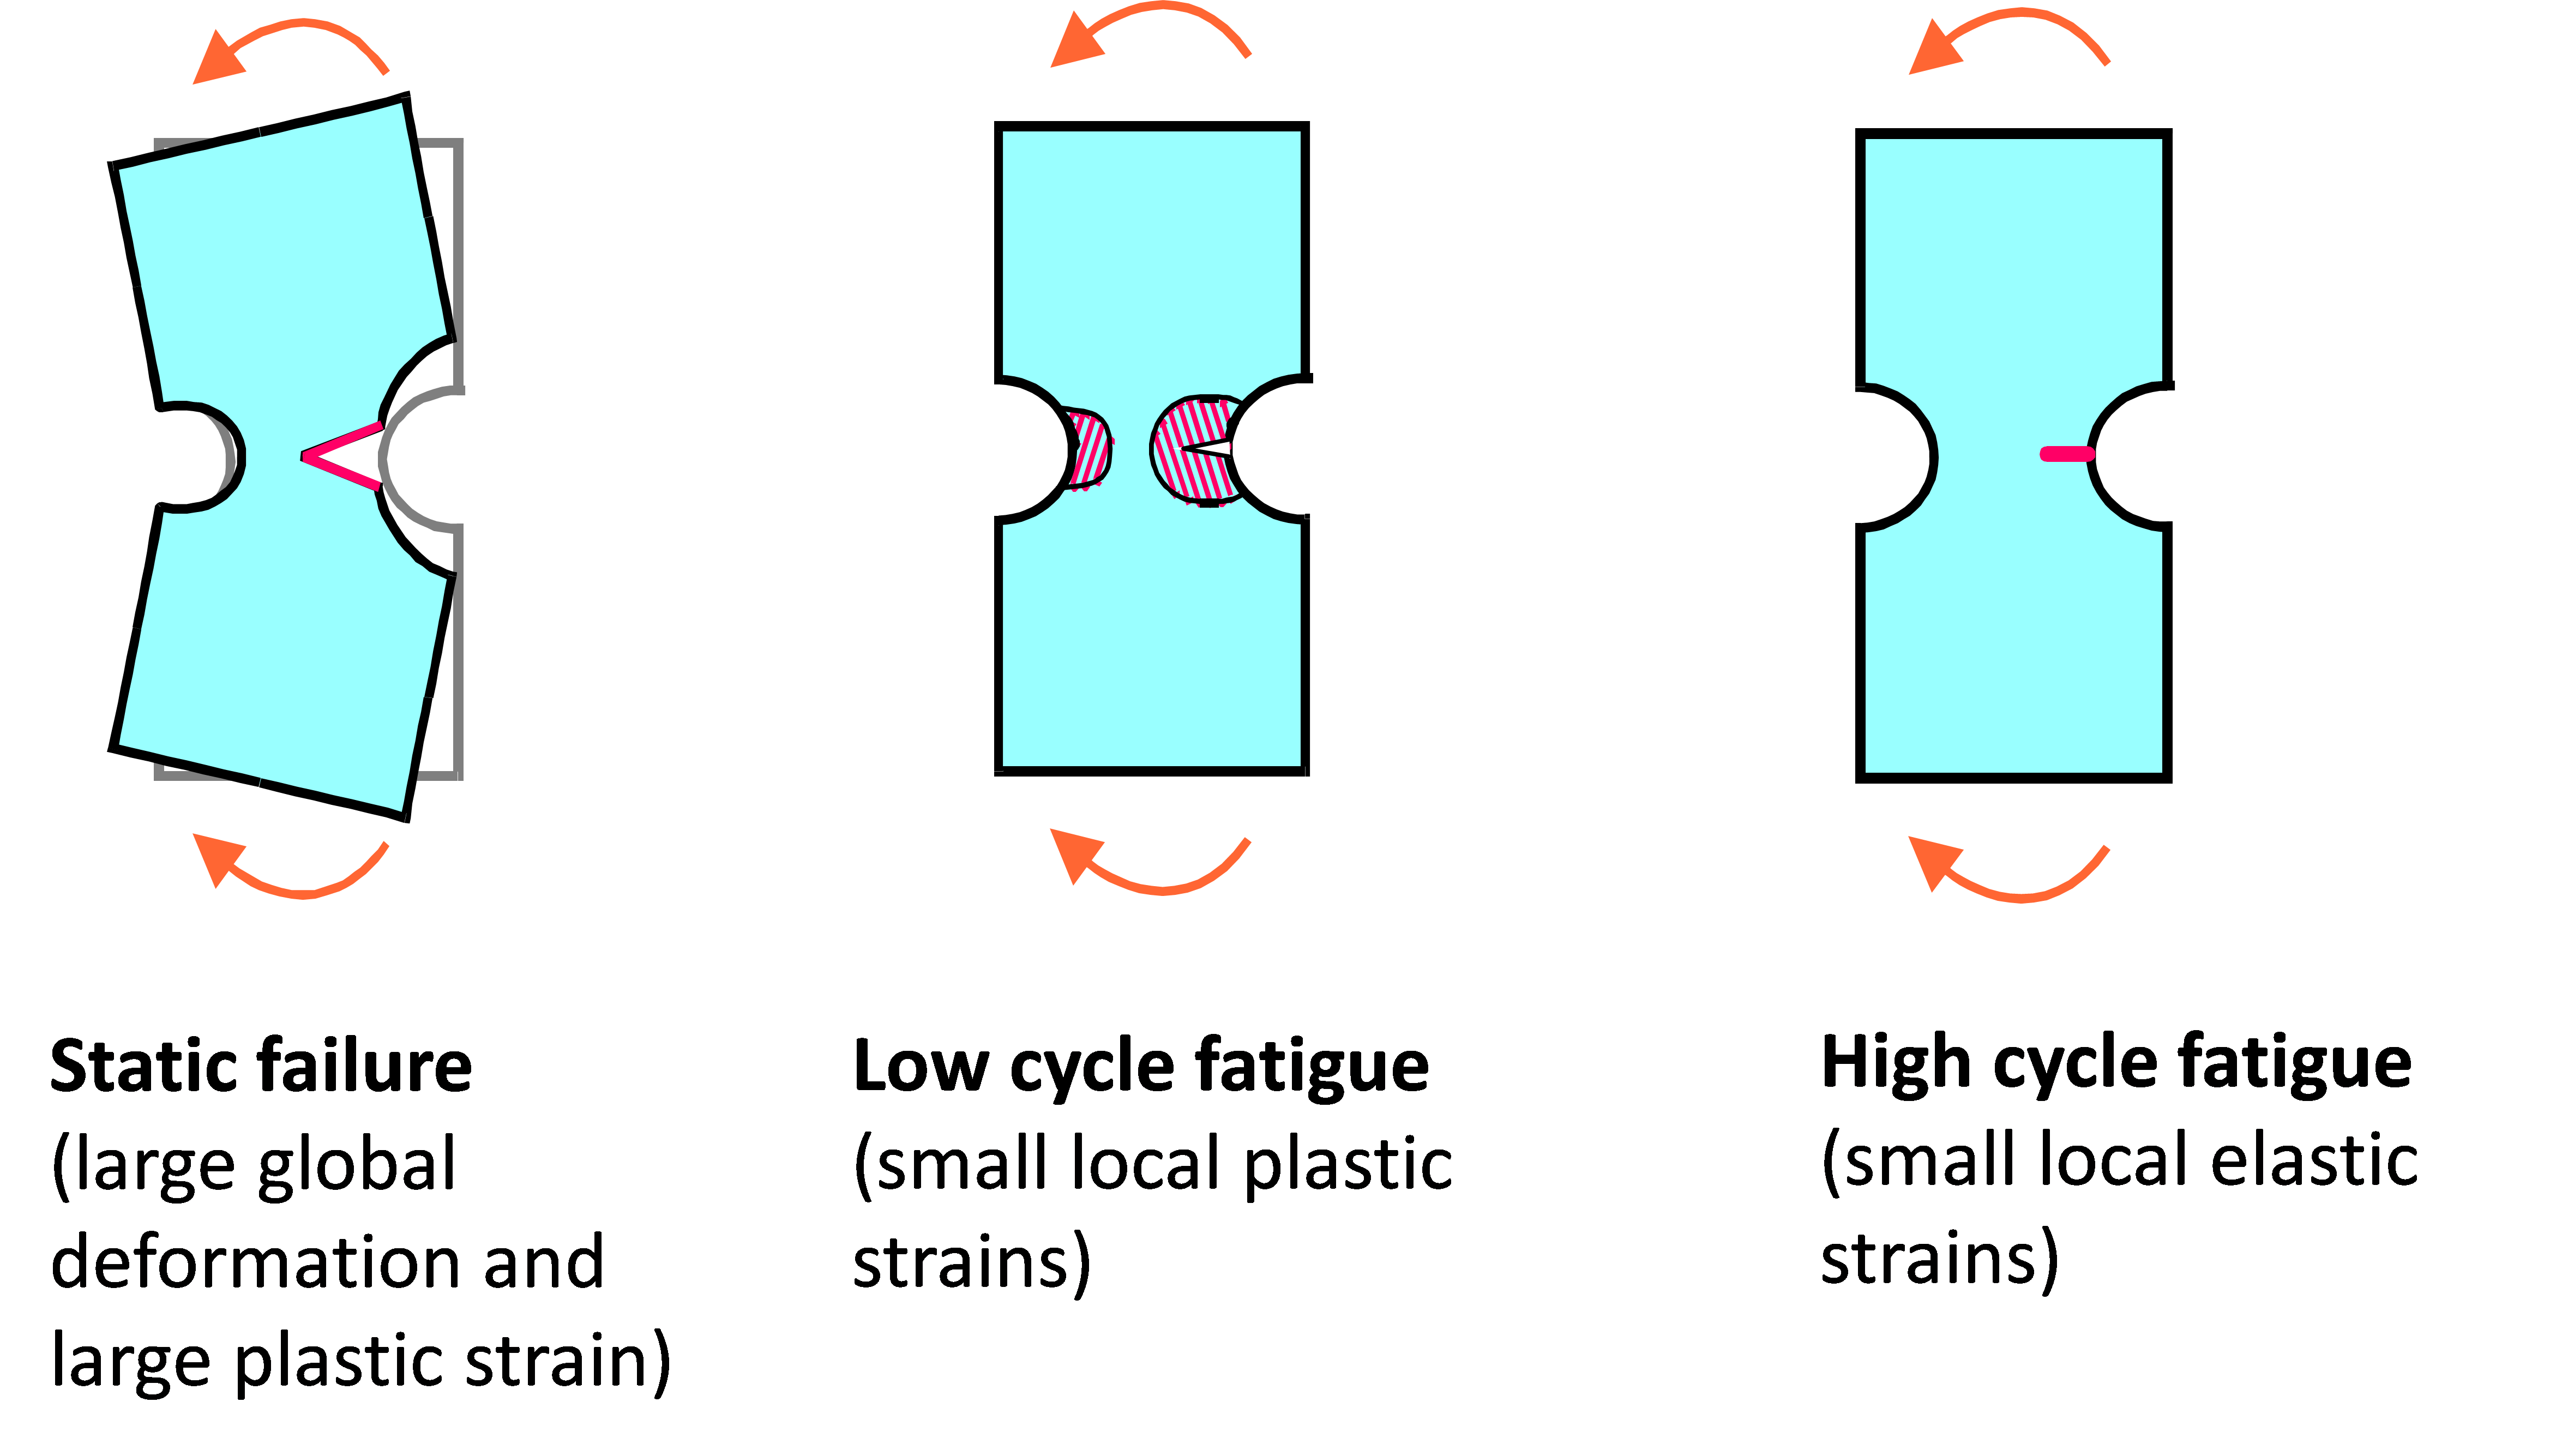
Figure 2: Different failure modes for a structure (static failure (left), low cycle failure (middle), high cycle failure (right))
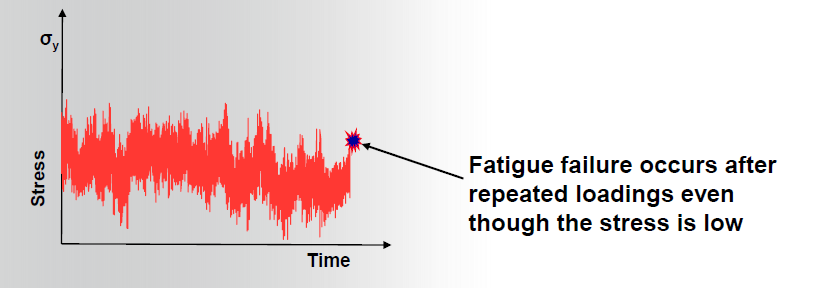
Figure 3: Repeated loading for high cycle fatigue
Loading
In reality, a structure is subjected to random loading or a sequence of loads with different magnitudes. A technique that is used to convert the random loading to simple cycles is called rainflow cycle counting algorithm as shown in Figure 4. Each rainflow cycle causes an amount of damage, which is combined through Miner’s rule to a total amount of fatigue damage for a structure. The damage fraction at a stress level is equal to the number of cycles applied at that stress (n) divided by the fatigue life (N) at that stress:  with Di = damage fraction accumulated during load cycles at interval i at stress level i ni = number of applied load cycles at stress level i Ni = fatigue life at stress level Si obtained from S-N curve
 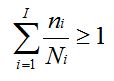 Miner’s rule says that the total damage is the linear summation of the damage fractions and failure occurs when the sum of the damage equals 1.0.
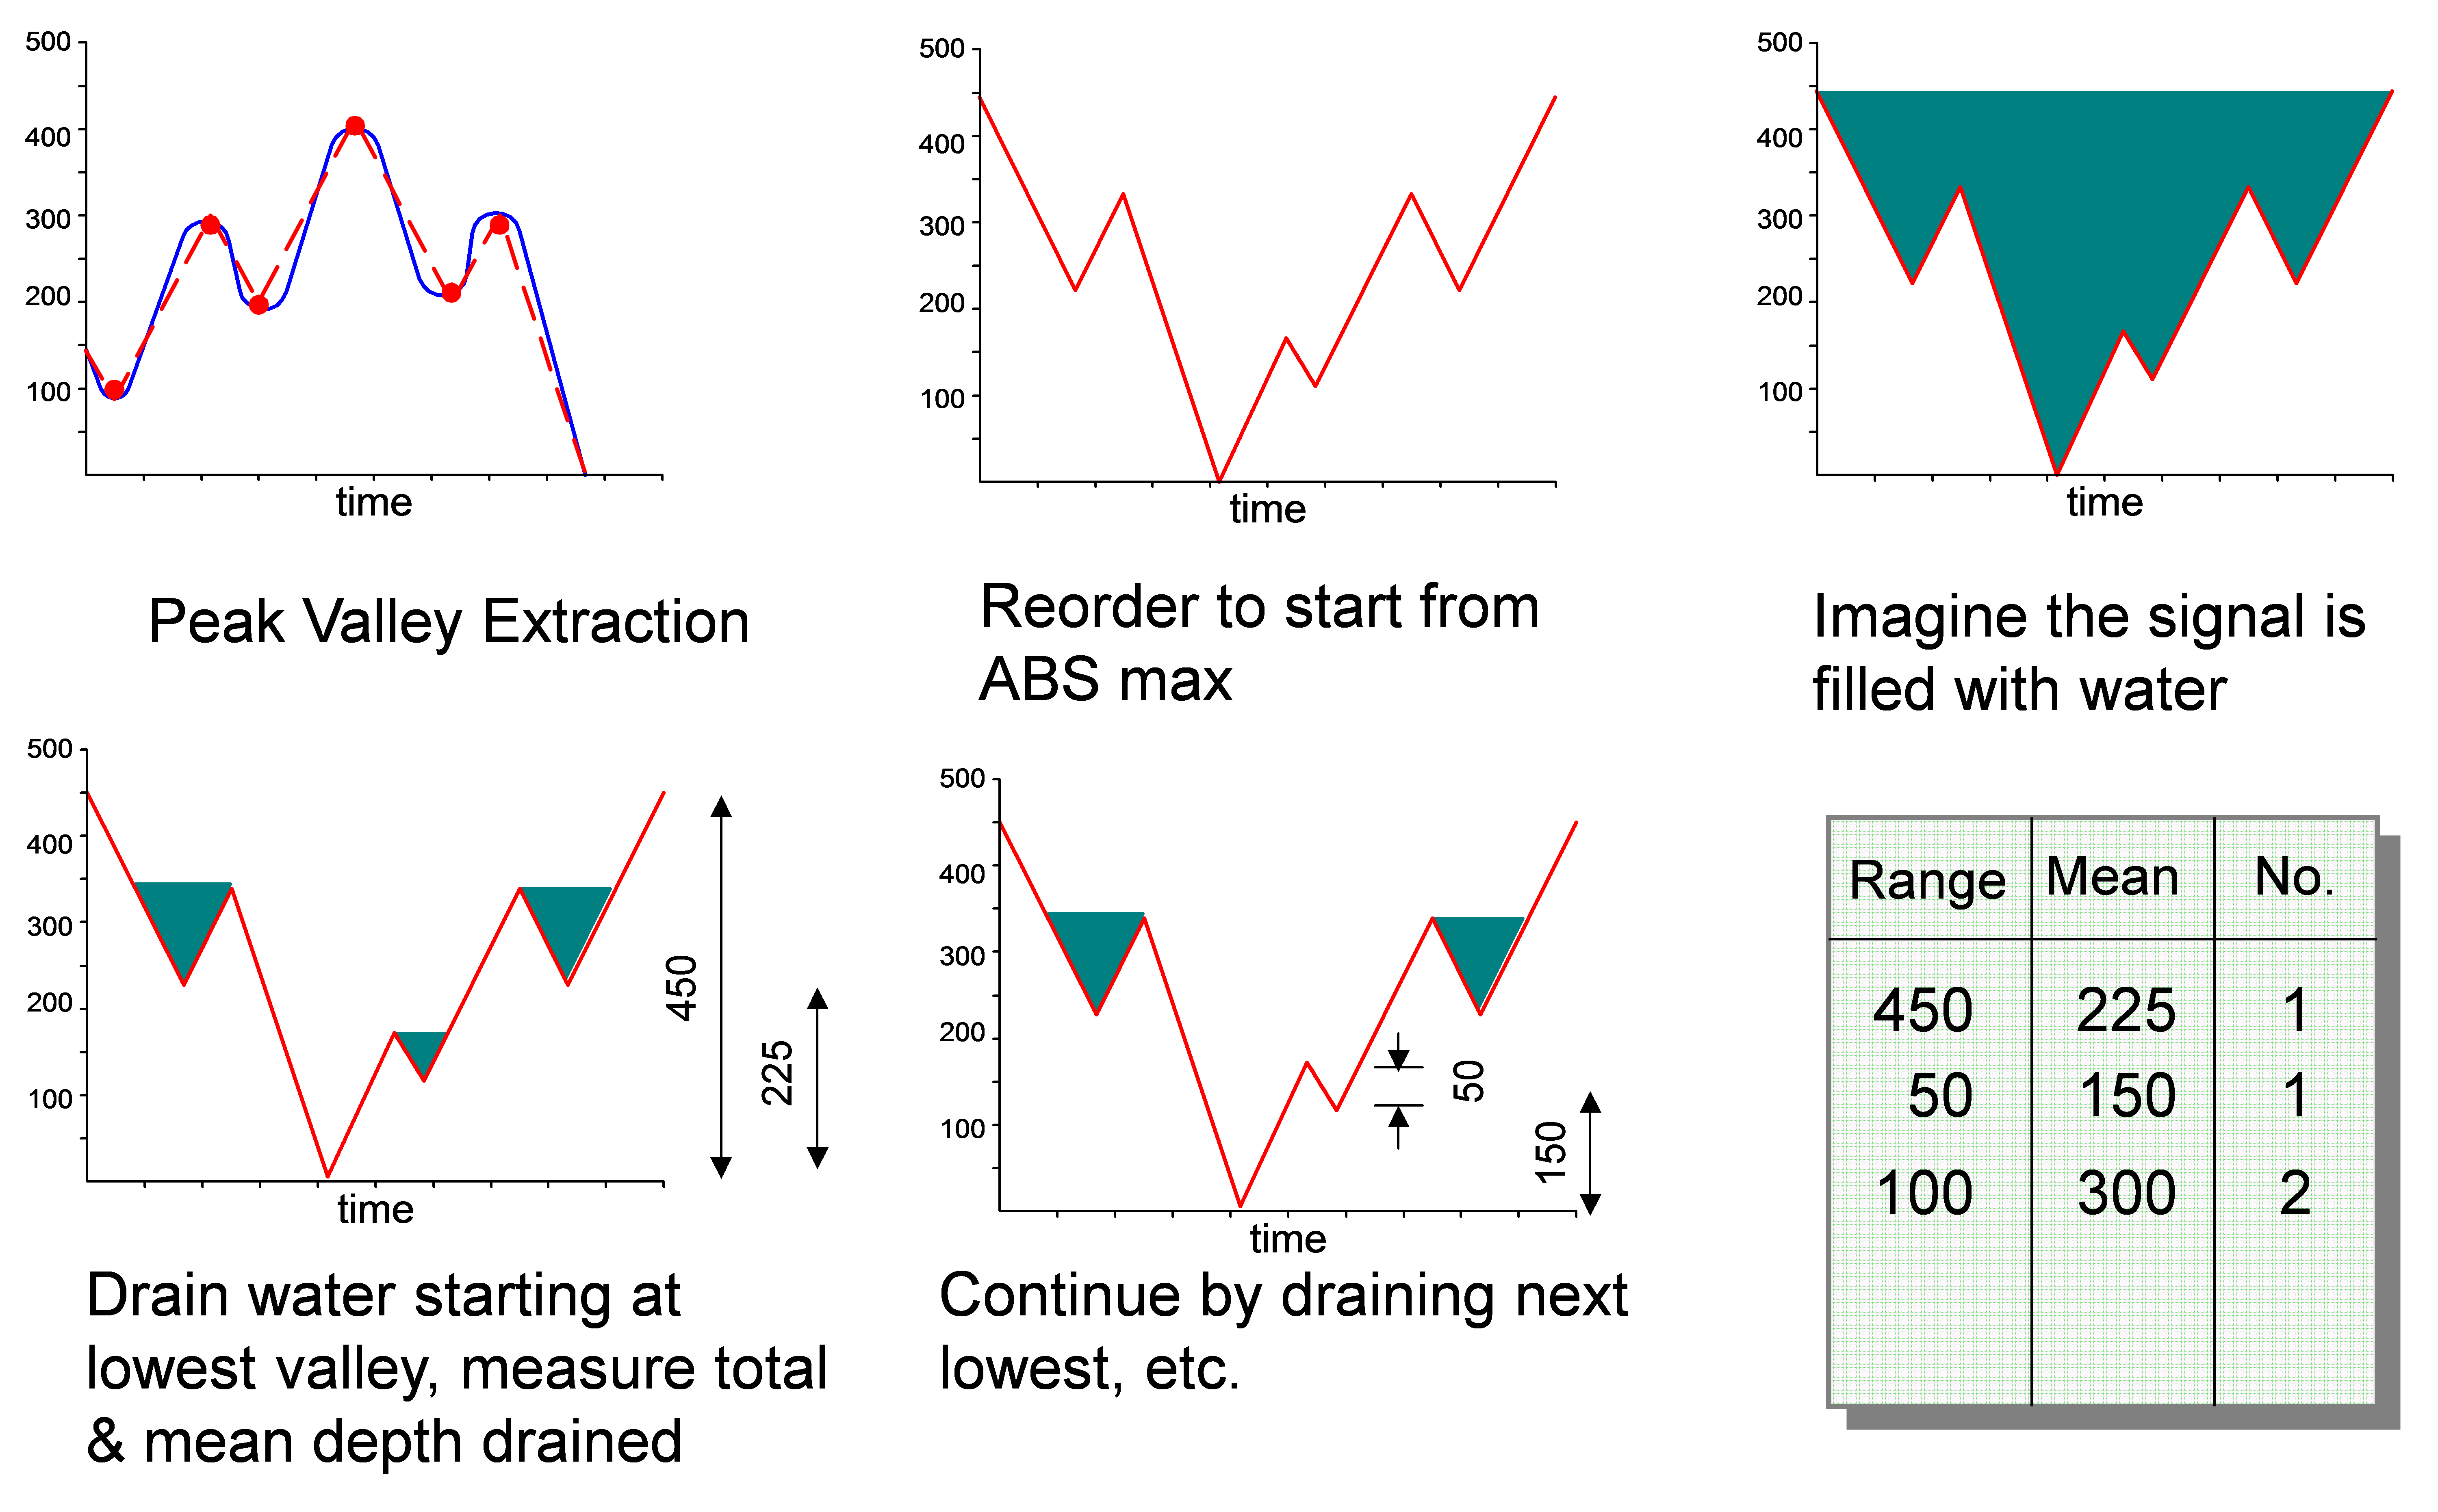
Figure 4: The rainflow cycle counting algorithm is used to convert random signals into simple cycles. Each cycle causes an amount of damage which contributes to the total life of the structure
High Cycle Fatigue
In high-cycle fatigue situations, materials performance is commonly characterized by an S-Ncurve, also known as a Wöhler curve. This is a graph of the magnitude (or stress range) of a cyclic stress (S) against the logarithmic scale of cycles to failure (N).
S-N curves are derived from tests on samples of the material where a regular sinusoidal stress is applied by a testing machine. The test is then repeated for stress cycles with different amplitudes and the outcomes are recorded and combined to construct a relation between stress and life. The progression of the S-Ncurve can be influenced by many factors such as corrosion, temperature, residual stresses, and the presence of notches. Statistical methods are used to construct the S-N curve for a certain probability of survival as shown in Figure 5.
In summary, for the Stress-Life (SN Analysis):
- The S-N approach is widely used
- Uses S-N curves from material tests
- Includes methods for mean stress correction
- Rainflow cycle counting for irregular loads
- Adjustments for surface finish and heat treatments
- Also suitable for analyzing welded structures
- uses elastically calculated local peak stresses
- applicable to high cycle fatigue (greater than 100,000 cycles for metals)
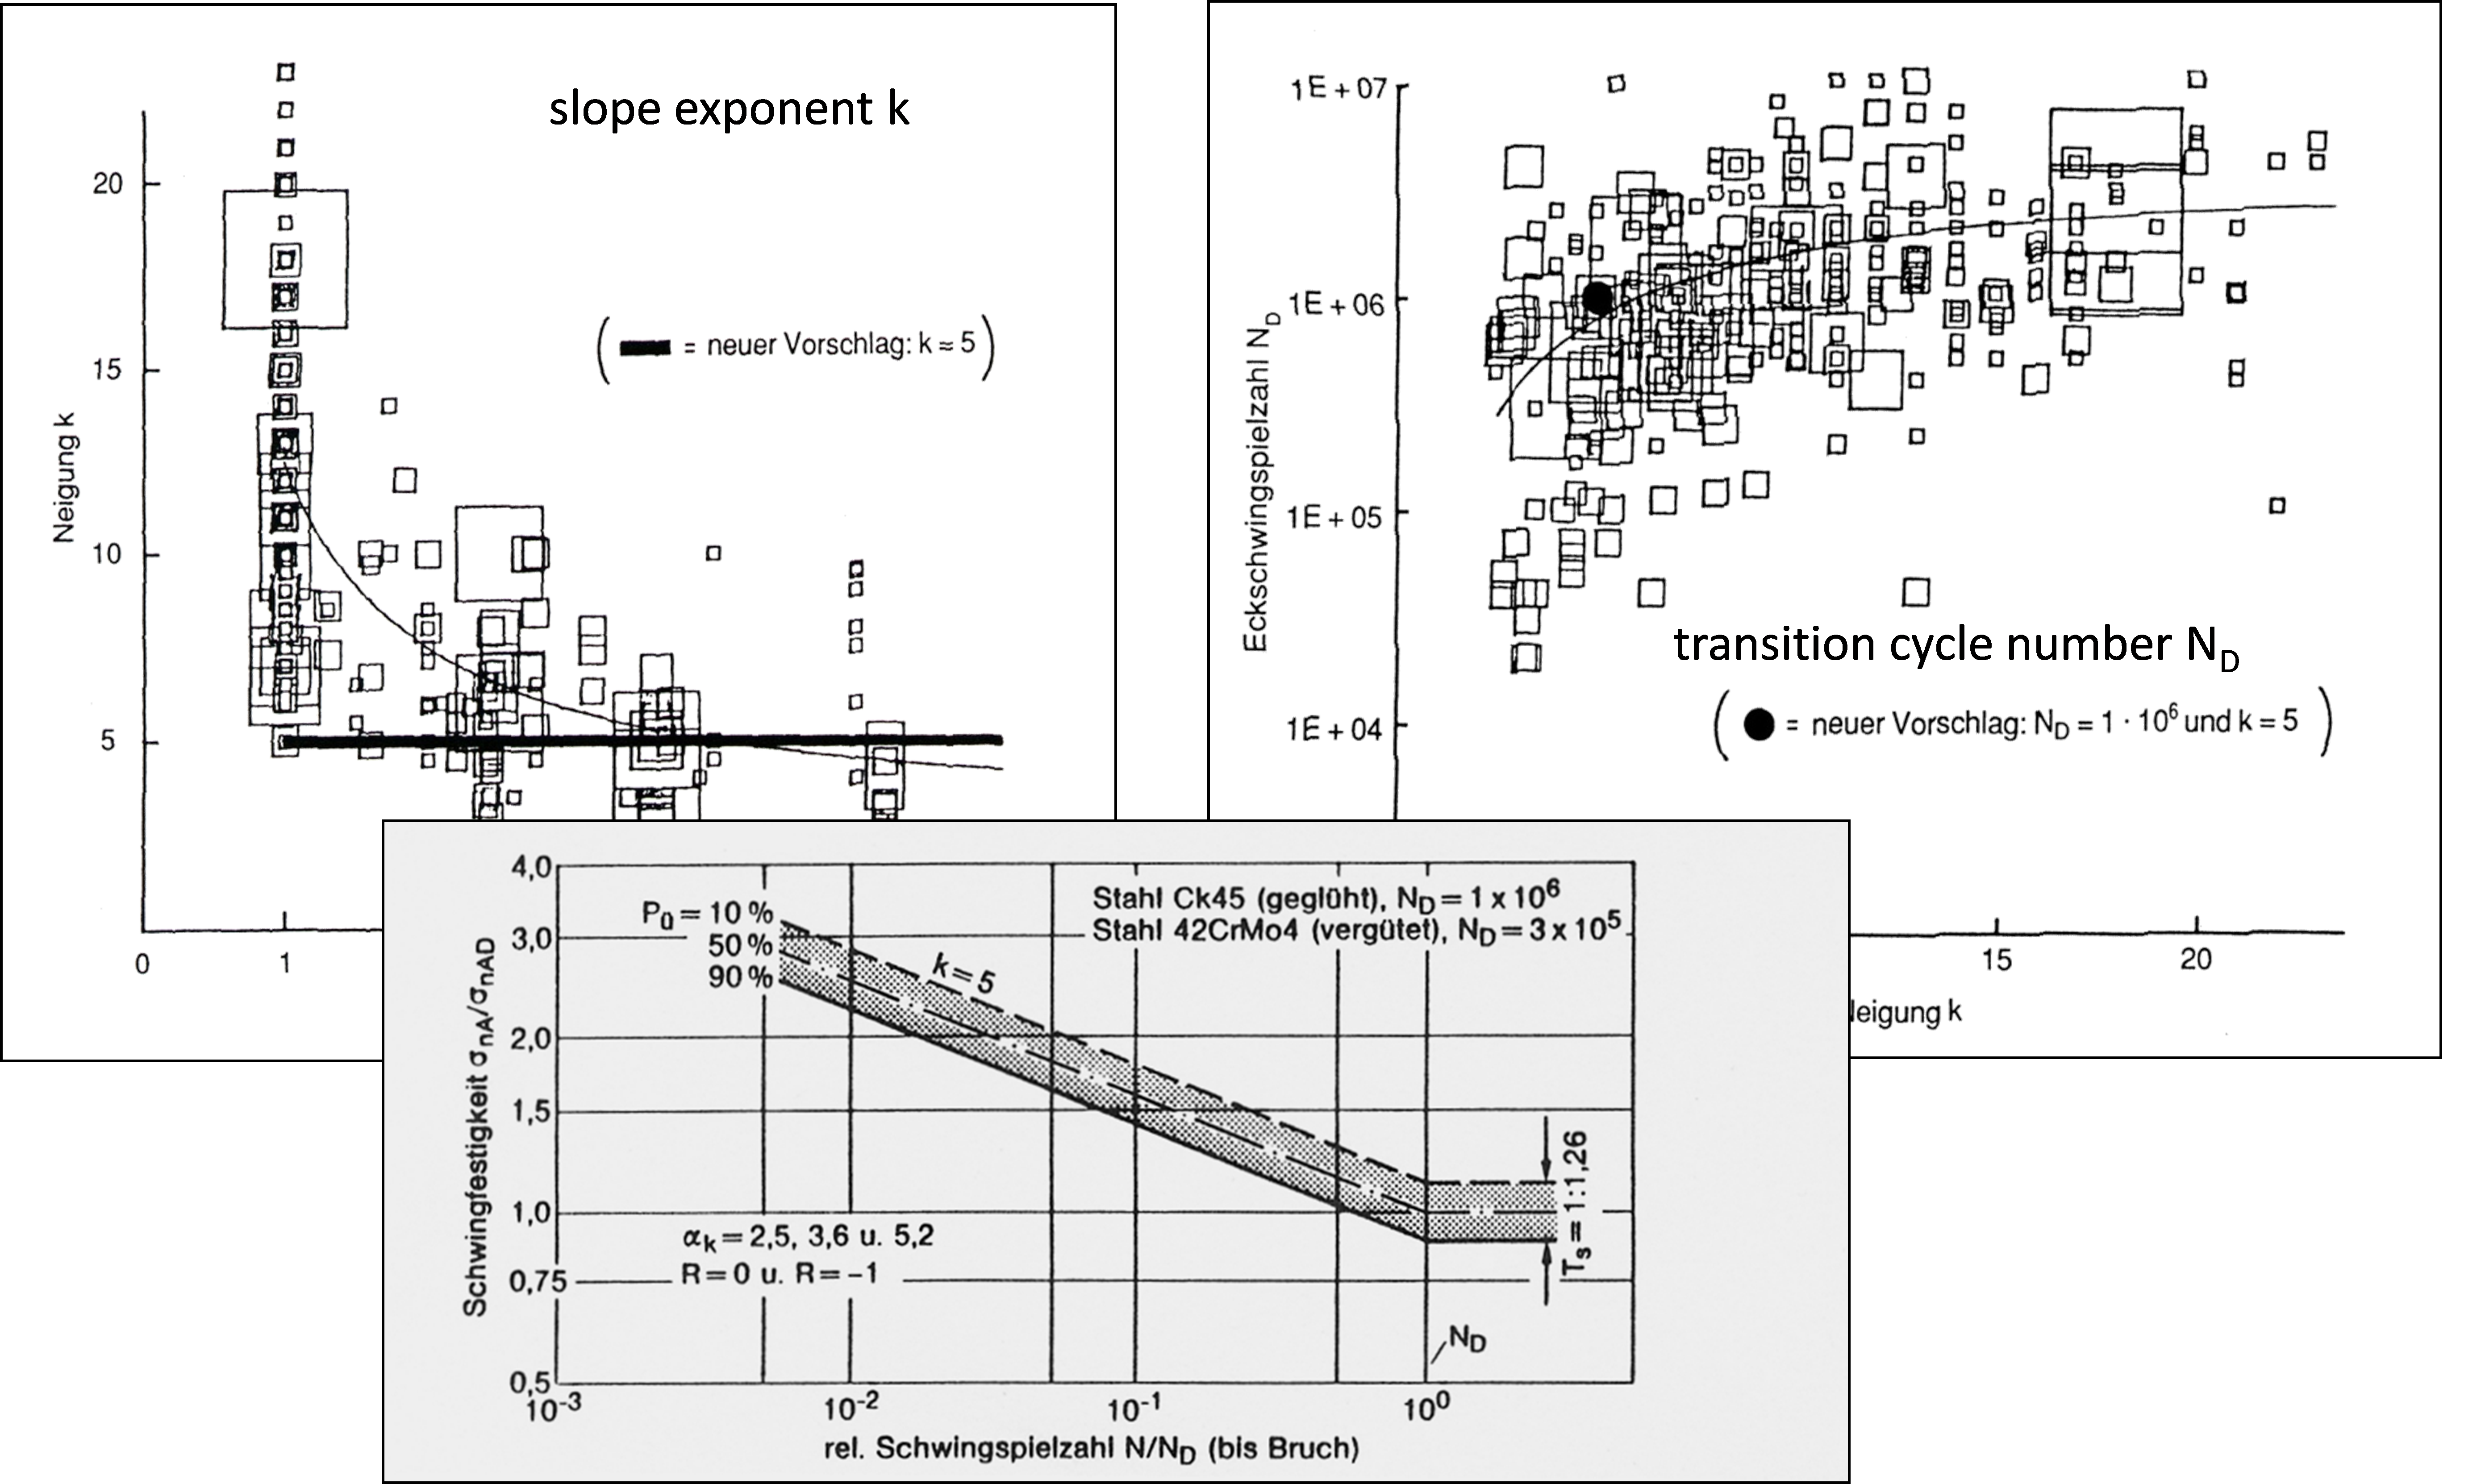
Figure 5: Material S_N curve constructed from testing and statistical methods
Low Cycle Fatigue
For most real-world components, the nominal stresses remain elastic, but occasional high loads and stress concentrations cause plastic deformation. Fatigue damage is controlled by the local plastic strains. When the stress is high enough for plastic deformation to occur, the accounting of the loading in terms of stress is less useful and the strain in the material offers a simpler and more accurate description. This is called low cycle fatigue (see second image in Figure 2), which uses a so called E-N curve instead of an S-N curve. The Strain Life Relation Equation is constructed from two separate curves (one for elastic life and one for plastic life) as shown in Figure 6.
In summary, for the the Strain-Life (EN or Crack Initiation Analysis):
- Local strain approach commonly used in automotive industry
- Predicts time taken to initiate a small crack – typically 1-2 mm
- uses elastic-plastic local strains
- Notch rules (eg Neuber) often used to estimate plastic strain
- Nonlinear FEA also used to determine plastic strain
- Corrections for mean stress, surface finish and heat treatments
- applicable to low and high cycle fatigue
Figure 6: The E-N curve consists of two parts (elastic and plastic life)
For estimating the onset of failure from repetitive loading, you no longer need laborious hand calculations or spreadsheets. Modern fatigue analysis tools ― like ANSYS nCode DesignLife (see below) ― predict the fatigue life of both components and complete products rapidly and accurately. Figure 7 shows a flowchart of the process.
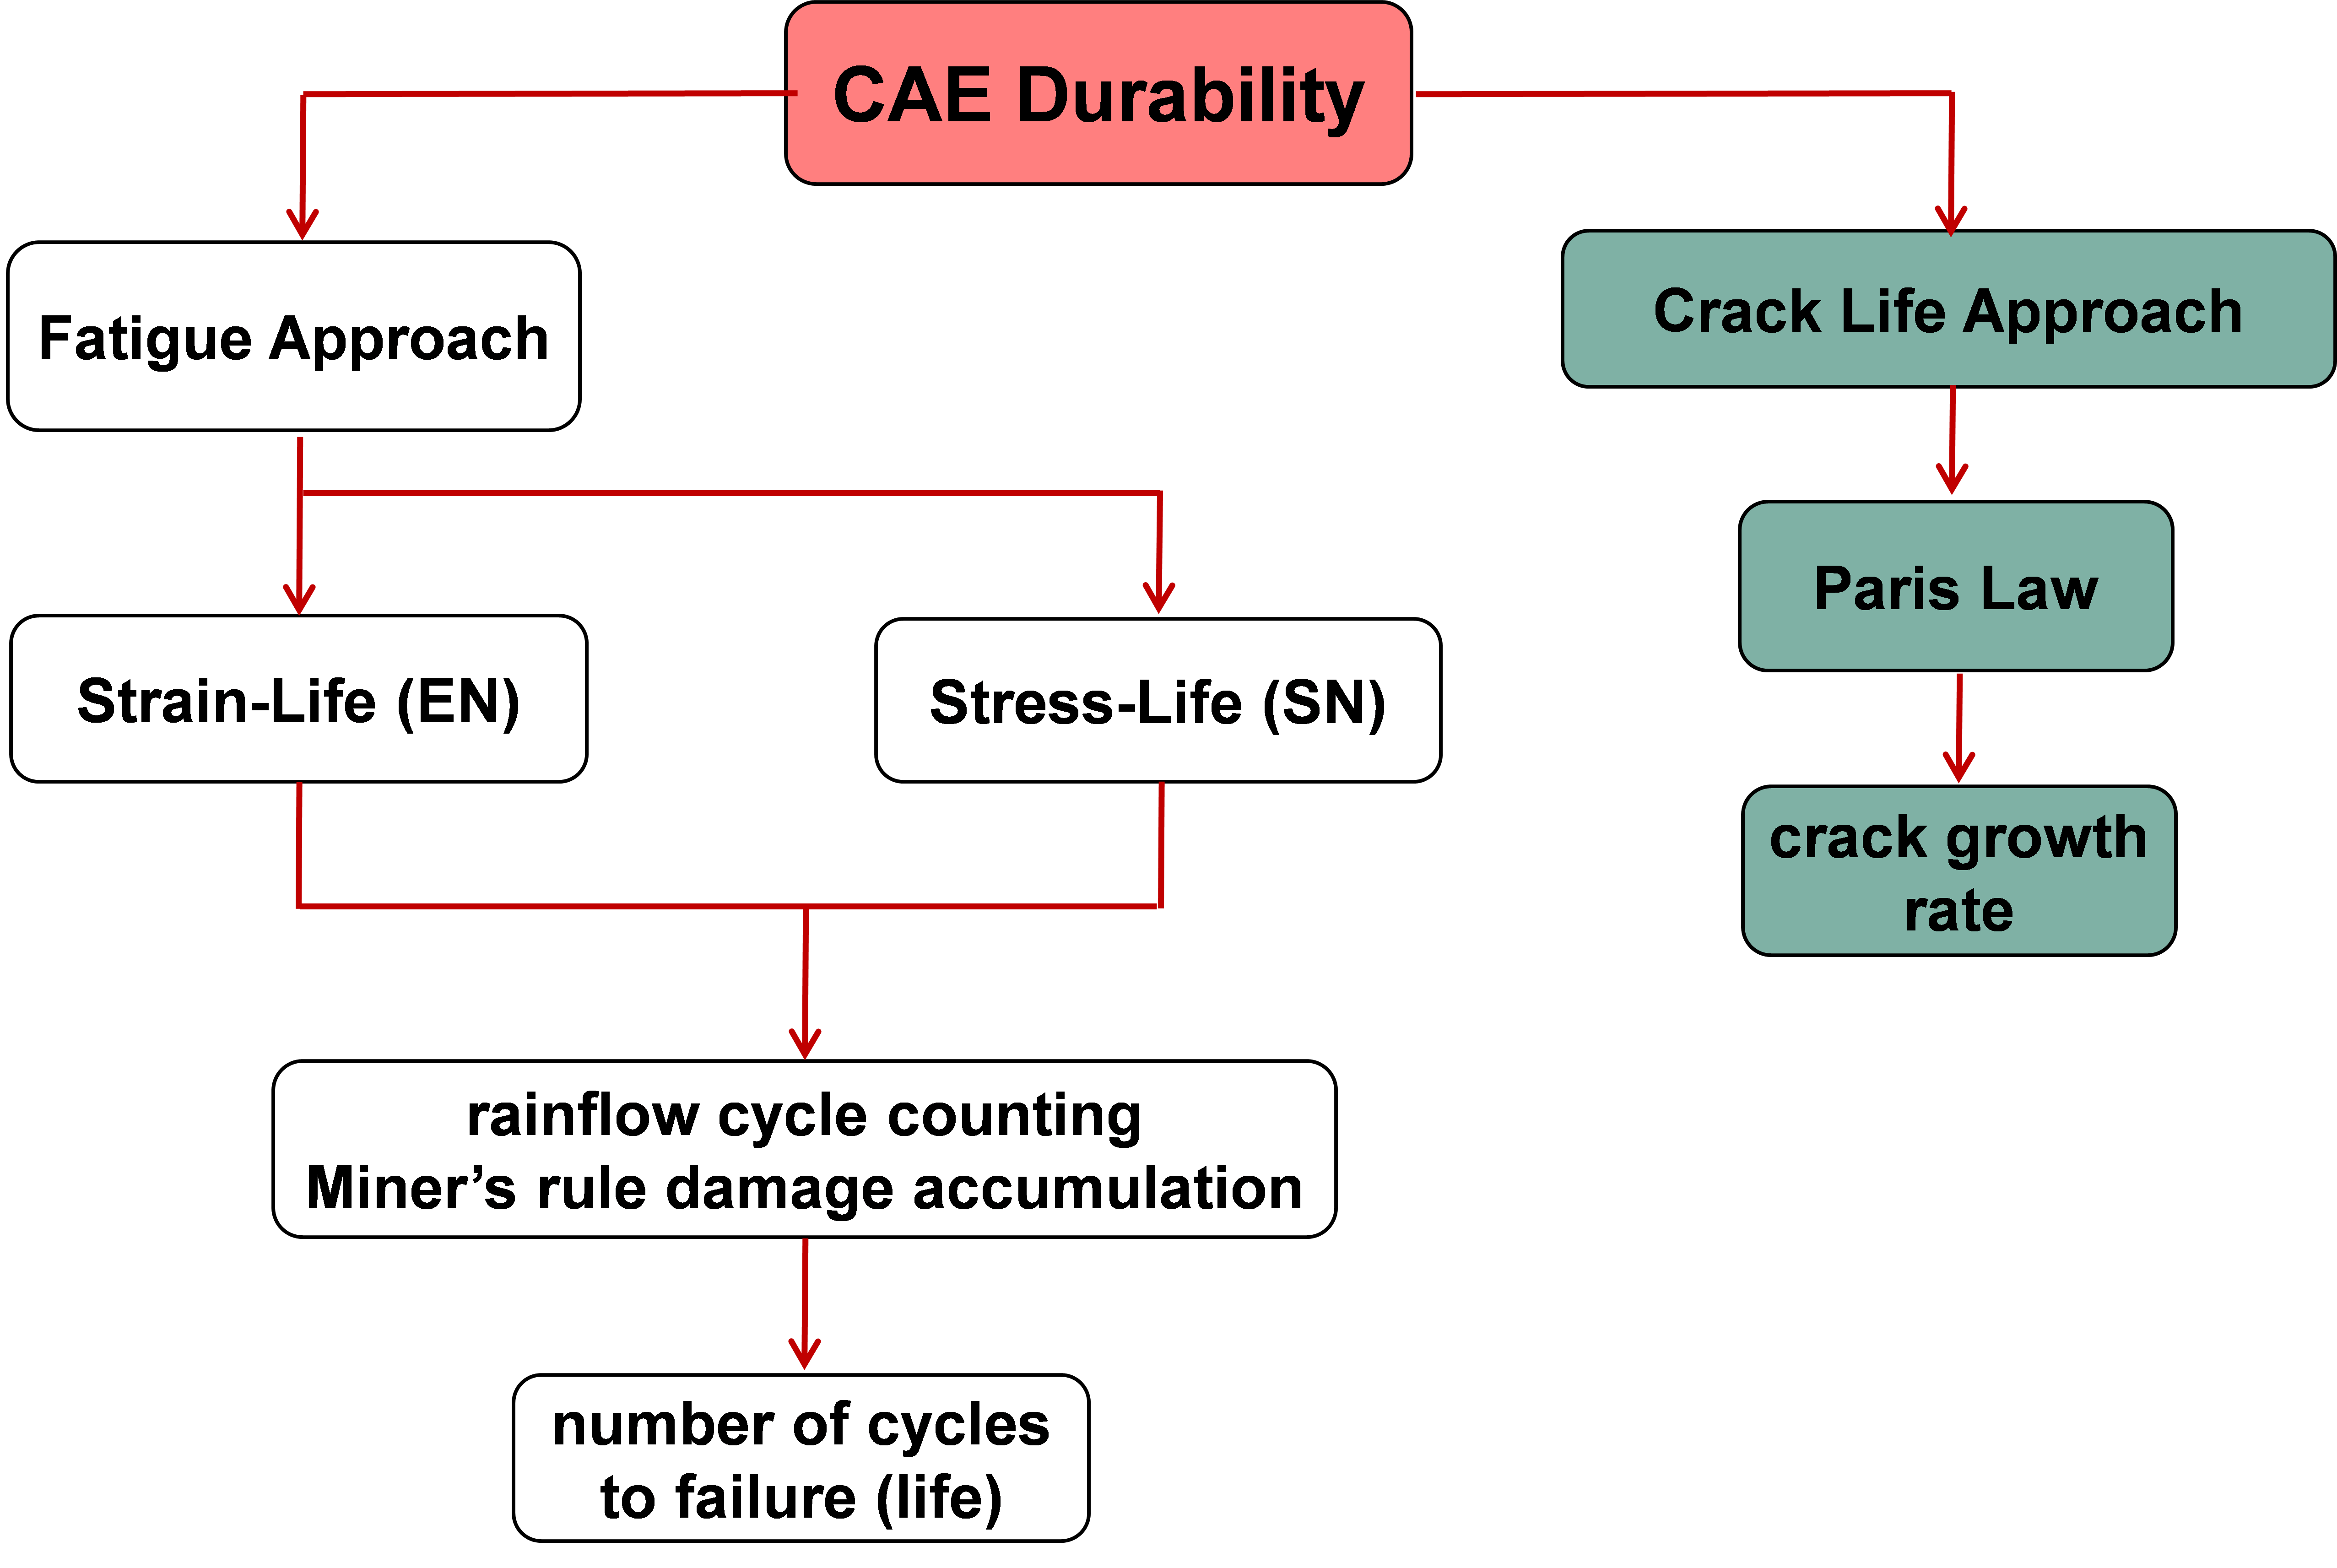
Figure 7: Flowchart of CAE Durability Analysis
Figure 8 shows the CAE process. Fatigue finite element analysis starts with a structural simulation to calculate the stresses and strains in a model due to a single load. You then combine these results with material models and a description of the repetitive loading that the product is expected to undergo during its use.
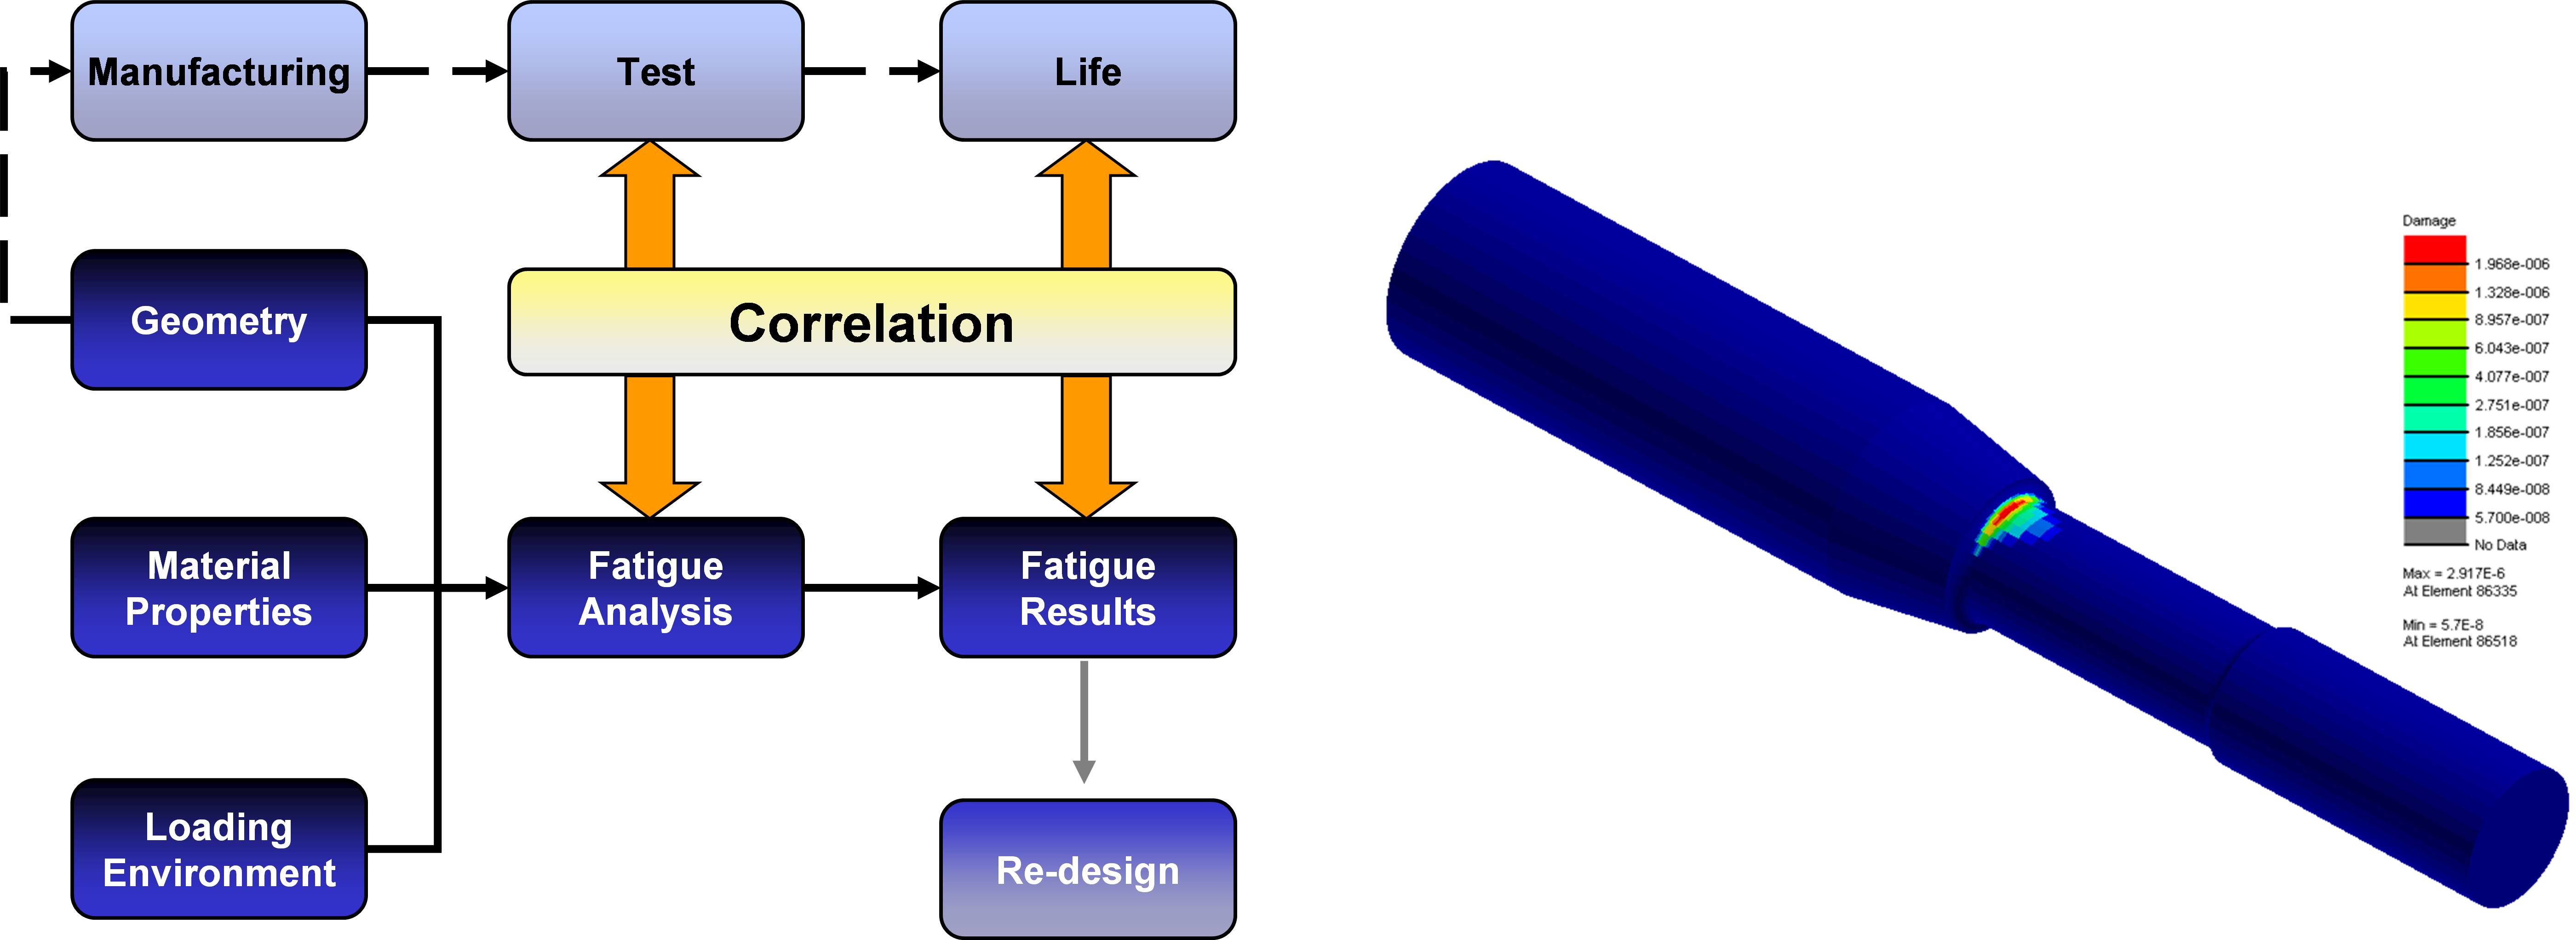
Figure 8: CAE Fatigue Process
Ansys nCode DesignLife
ANSYS nCode DesignLife automates this comprehensive fatigue analysis process and accurately captures all data, data flow and parameters in ANSYS Workbench, which offers an integrated environment for ease of use and high user productivity.
Improving durability is increasingly important at the product design stage. With ANSYS nCode DesignLife you can quickly evaluate the use of different materials and alternate geometries for new product designs and then optimize them for the product’s lifetime ― long before the first prototype is built. Fatigue simulation is the most powerful and cost-effective way to optimize product design to avoid failure.
The fatigue technology within ANSYS nCode DesignLife incorporates the following capabilities:
- Extensive fatigue material library
- Methods to estimate fatigue life (Stress life method (SN), Strain life method (EN), Fatigue crack growth)
- Spot weld
- Seam weld
- Thermomechanical fatigue
- Composites
- Dang Van endurance limit for complex loading
ANSYS nCode DesignLife software is fully integrated into the ANSYS Workbench platform (as shown in Figure 9), so users benefit from the combined power of the two systems, including shared material models for fatigue in engineering data, easy click-and-drop problem setup, use of parameters for optimization, and design exploration.
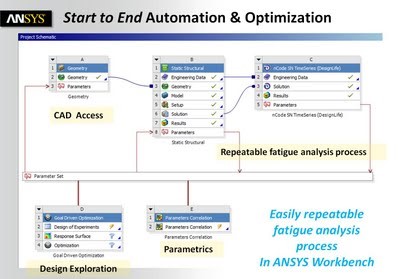
Figure 9: The integrated ANSYS Workbench environment
The nCode material library, integrated within ANSYS nCode DesignLife as part of engineering data, can be used for structural mechanics analysis to ensure that the same material response is represented in the complete simulation (see Figure 10).
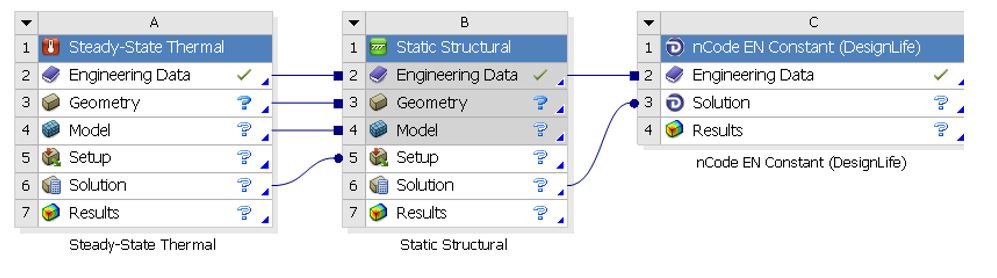
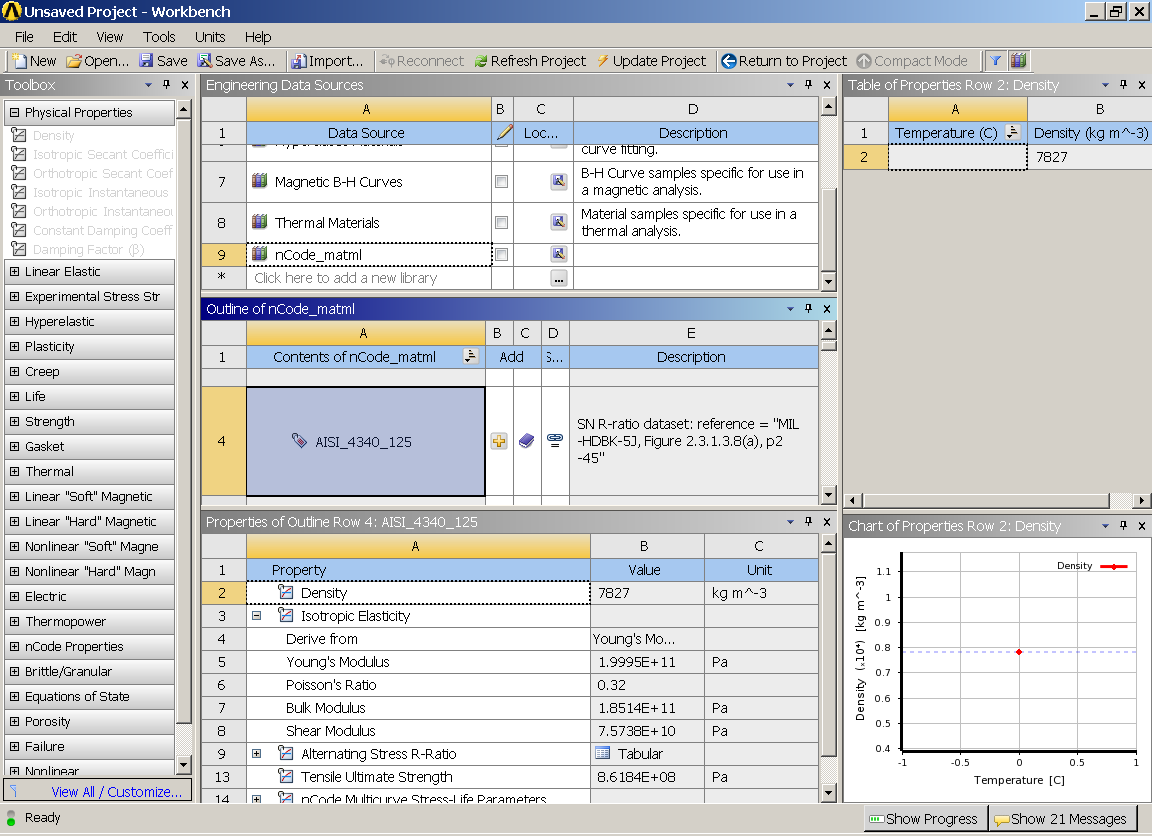
Figure 10: The Engineering data in ANSYS Workbench include they material library for fatigue properties
ANSYS nCode DesignLife combines the maximum stress and strain response from a single loading in a structural analysis, with one or more loading histories.
The histories can come from physical tests results, such as a car driven on a test track equipped with a number of strain gauges and accelerometers or from a stipulated theoretical loading history.
Using material fatigue data collected from experiments and stored as part of the DesignLife material library, the number of loading cycles (hence time) when a part will fail from fatigue is calculated as shown in Figure 11. Figure 12 shows an example of model set up in ANSYS nCode DesignLife. The fatigue analysis can either be done in the time or frequency domain as shown in Figure 13.
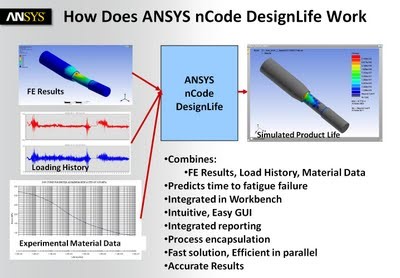
Figure 11: The process in ANSYS nCode DesignLife
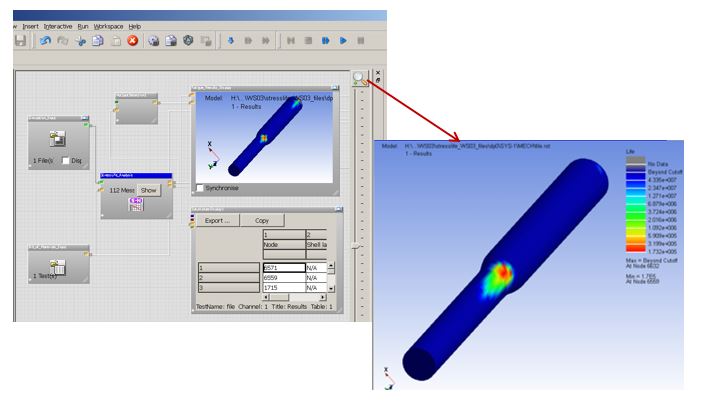
Figure 12: Example in ANSYS nCode DesignLife
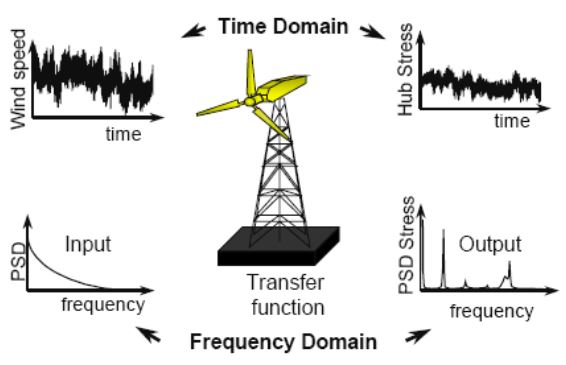
Figure 13: The fatigue analysis can be conducted in the time domain and in the frequency domain
For more information please contact LEAP Australia.